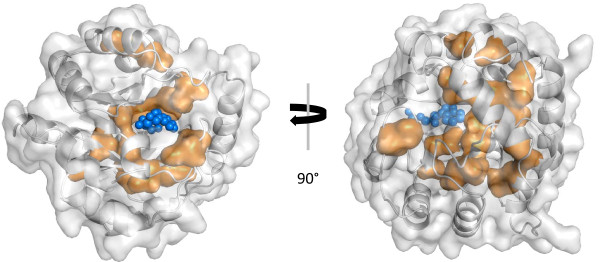
Figure 2.
Localization of STRUC_sites in sIGPS. Based on PDB-ID 1A53, the surface of the whole protein (grey) and of residues predicted as STRUC_sites (orange) is shown. The substrate indole-3-glycerole phosphate is plotted in dark blue. The picture was generated by means of PyMOL [39].

