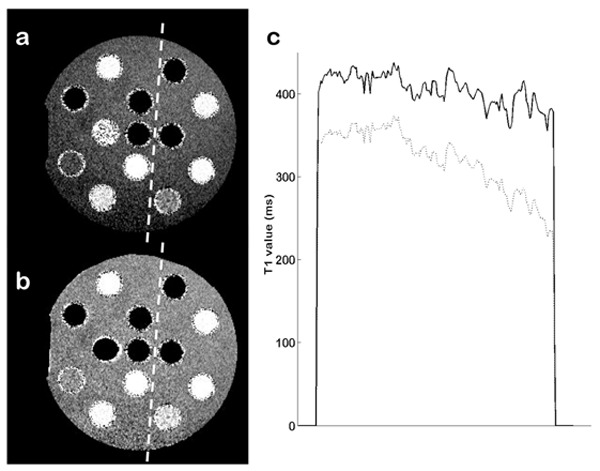
Figure 7.

T1 maps of test-object using VFA (flip angles=[2,16]°, TR=6 ms) at 1.5T. (a) Uncorrected T1 map. (b) T1 map corrected with maps of both flip angles used. (c) Cross-section following the white dashed line on the uncorrected (dotted line) and corrected (solid line) T1 maps
