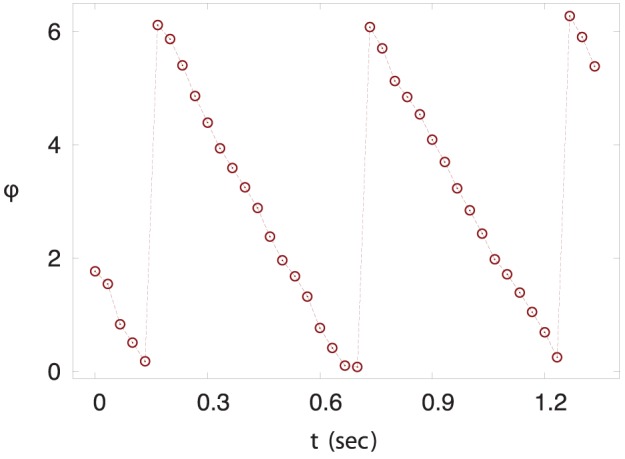
Figure 12. The phase evolution .

 for a sequence of images of
C. elegans
swimming in water. The sequence of images from the movie of a swimming C. elegans was fitted using harmonic-curvature function (8) with the phase
  varying from frame to frame and the amplitude
  and wavevector
  identical for all frames.
