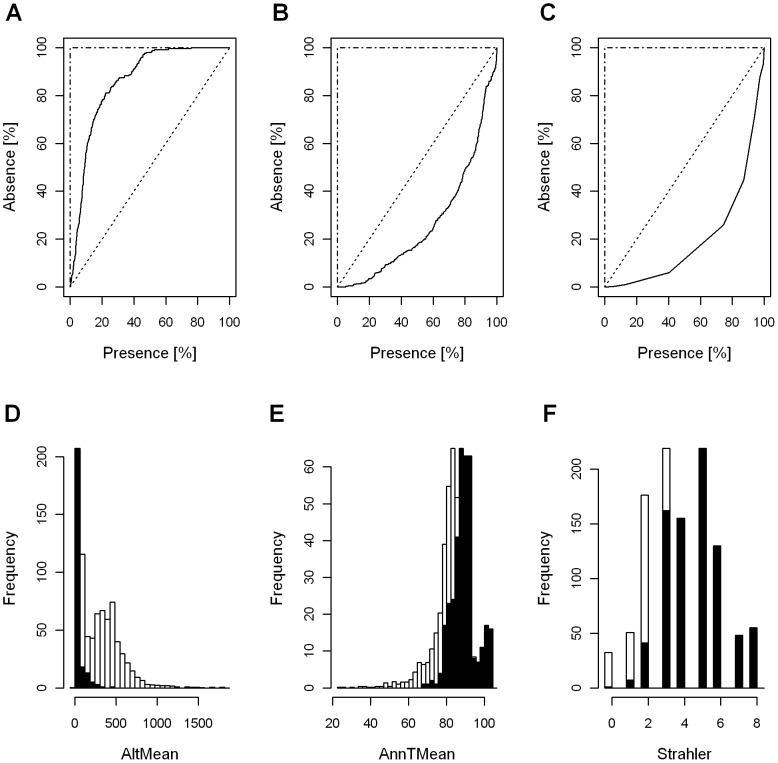
Figure 1. Lorenz Curve and the empirical probability distributions.
(A, D) L. fluviatilis, (B, E) S. glanis (b, e) and (C, F) B. barbus. The ROC score of 0.85 for AltMean (L. fluviatilis), 0.73 for AnnTMean (S. glanis) and 0.8 for Strahler (B. barbus) indicate high discriminatory power of the individual predictors in describing species presence (shaded bars) and absence patterns.

