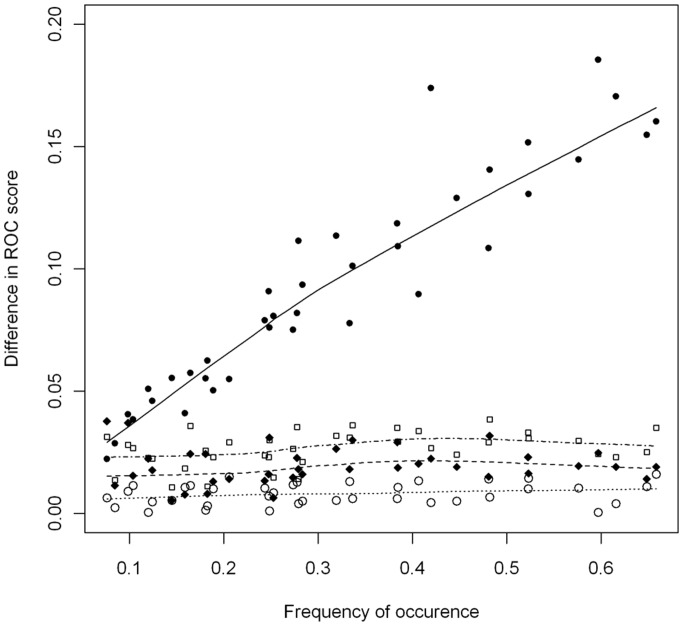
Figure 2. Relationship between species occurrence frequency and the ROC score.
The ROC score difference is calculated as the absolute deviation of the average validation ROC score for the particular method from the total average validation ROC score for all applied SDMs (GLM, GAM and RF). The trend line is based on locally weighted scatterplot smoothing: ME (solid line), GAM (dotted line), GLM (dashed line), RF (dot-dash line).

