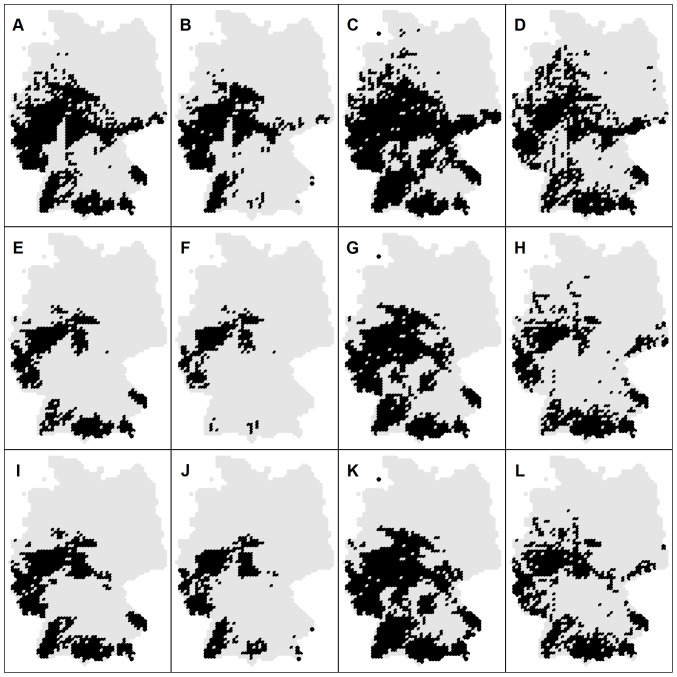
Figure 4. Potential distribution patterns for 2050s under A1b scenario for C. gobio.
Each row shows the results of the particular climate model: (A–D) ECHAM5, (E–H) HADCM3 and (I–L) IPSL-CM4. The first column shows the result of the mean consensus model based on all repetitions of GAM, GLM and RF, followed by the mean future projections using all repetitions of the individual models: GAM, GLM and RF, respectively. Gray dots indicate centroids of the grid cells across the whole study area (Germany).

