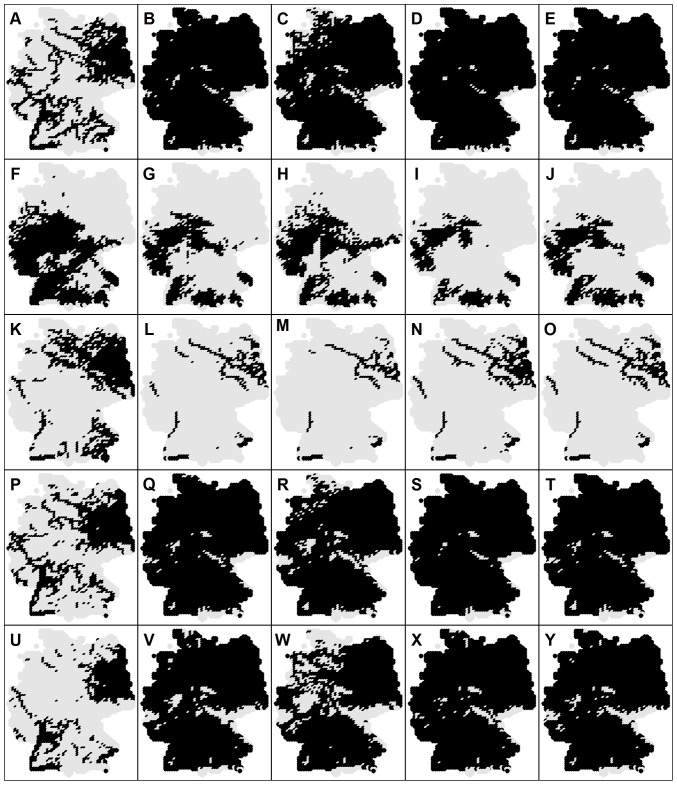
Figure 5. Current and the potential future distribution patterns of selected species for 2050s under A1b scenario.
Each row shows species specific results: (A–E) A. alburnus, (F–J) C. gobio, (K–O) L. lota, (P–T) S. lucioperca and (U–Y) S. glanis. The first column is the consensus model of current species distribution based on all repetitions of GAM, GLM and RF, the second shows the result of the ensemble forecasting based on the combination of all SDM's (including repetitions) and all climate projections, followed by the maps showing the mean consensus model based on all SDM's (including repetitions) and ECHAM5, HADCM3 and IPSL-CM4 climate projections, respectively.

