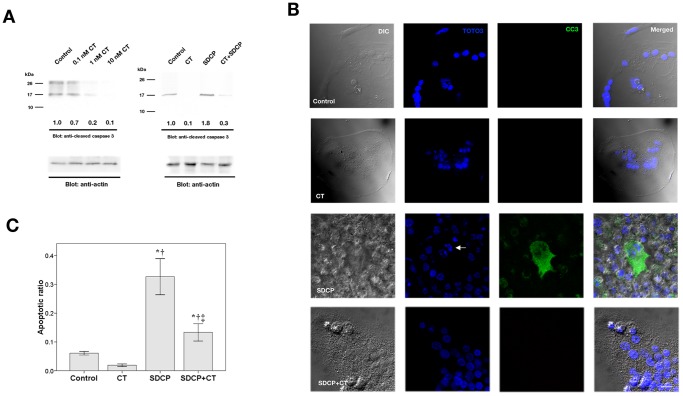
Figure 3. Calcitonin inhibits SDCP-induced expression of cleaved caspase 3 in osteoclasts.
(A) Western blot analysis of cleaved caspase 3 expression in osteoclasts treated with CT (10 nM), SDCP (10 µM), or both. Protein levels were quantified by densitometry, corrected for the sample load based on actin expression, and expressed as fold-increase or decrease relative to the control lane. Each blot is representative of at least three replicate experiments. (B) Confocal analysis of immunofluorescent labeling of cleaved caspase 3 in calcitonin- or SDCP-treated osteoclast. Green intracellular cleaved caspase 3 labeling and blue TOTO3-labeled nuclear chromatin condensation (white arrow) indicate cells that underwent apoptosis. Bar = 10 µm. (C) Quantitative results of the experiment shown in panel B. The measurement of apoptosis was calculated as a percentage of positive cleaved caspase-3–labelled cells in a total of at least 500 osteoclasts. P<0.05 compared to *control group, † CT group, and ‡SDCP group after Bonferroni adjustment, mean ± SD, n = 6 in each group.

