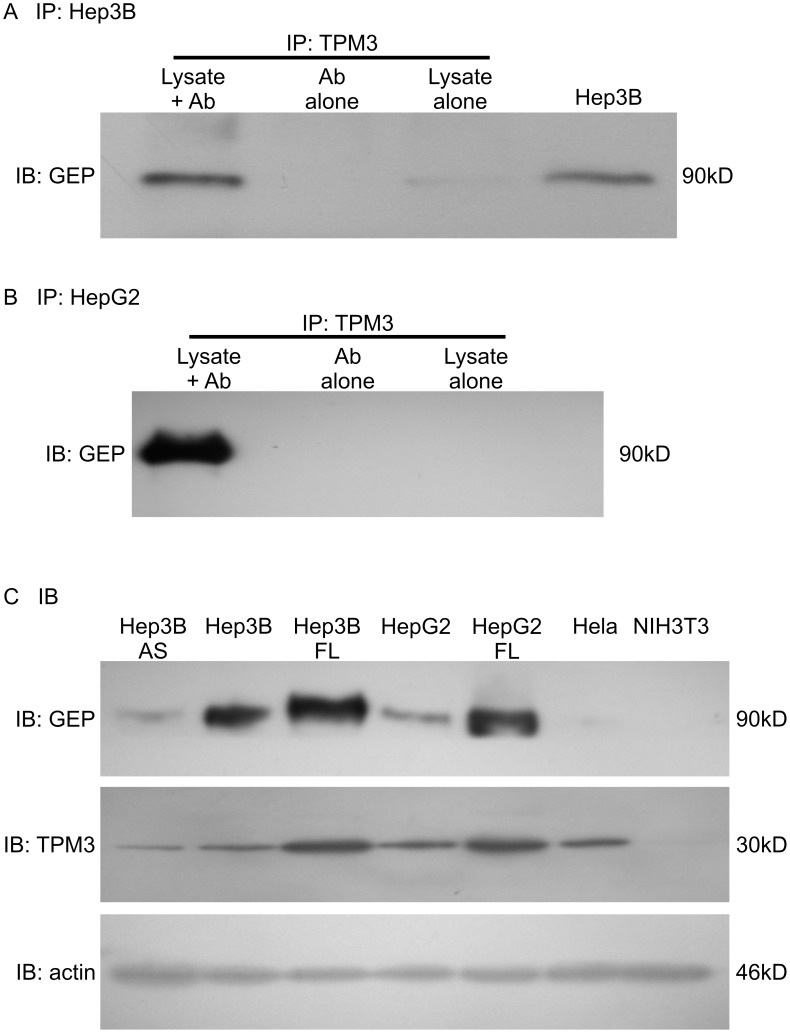
Figure 2. Association of TPM3 and GEP.
(A–B) Protein-protein interaction of TPM3 and GEP was validated by immunoprecipitation using anti-TPM3 antibody, followed with immunoblot detection using anti-GEP antibody in different cell lines (A) Hep3B and (B) HepG2 cells. (C) Positive correlation of GEP and TPM3 on protein level. AS: Cells suppressed for GEP by transfection with anti-sense GEP fragment; FL: Cells overexpressed for GEP by transfection with full-length (FL) GEP cDNA construct. Cells with overexpression of GEP showed elevated TPM3 levels, while suppression of GEP showed decreased TPM3.

