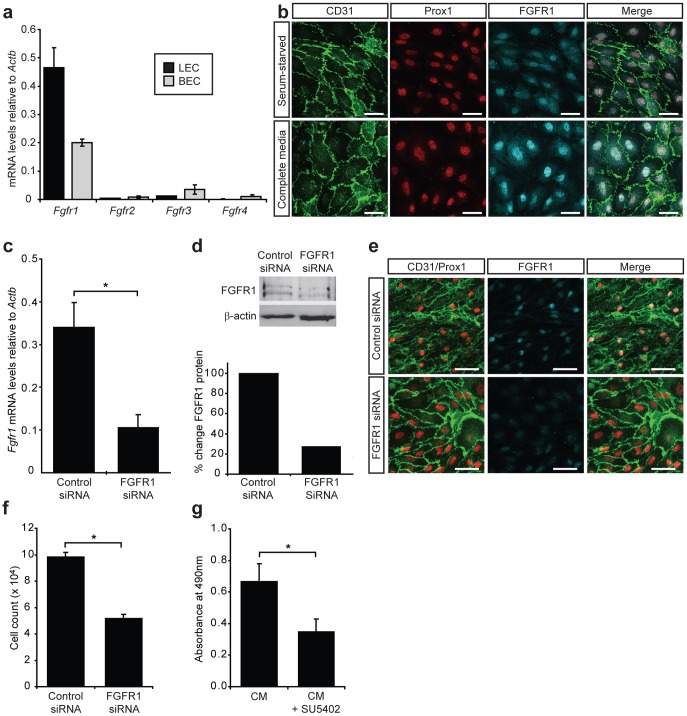
Figure 6. FGFR1 is important for LEC proliferation.
(a) FGF receptor profile in primary embryonic mouse dermal LEC and BEC. Real-time RT-PCR analysis of Fgfr1-4 mRNA levels in freshly isolated E16.5 LEC and BEC. Data are normalised to Actb and show mean ± s.d. of triplicate samples. Data are representative of at least three independent cell isolations from multiple litters of embryos. (b) FGFR1 is localized to the nucleus of LEC following stimulation with FGF2. Immunostaining of primary LEC cultured for 24 h in either EBM-2+0.5 mg ml−1 Albumax (serum starved) or EGM-2MV containing FGF2 (complete media). Scale bars represent 40 µm. (c) siRNA mediated knockdown of FGFR1 in primary embryonic LEC. Primary LEC were cultured for 24 h prior to transfection with control or Fgfr1 siRNA. Fgfr1 mRNA levels were analysed 72 h post-transfection. Data are normalised to Actb and represent mean ± s.e.m. Data are derived from 3 independent cell isolations, each prepared from multiple litters of embryos, and 3 transfections per isolation (n = 9). ***P<0.001. (d) FGFR1 protein levels were assessed by Western blot 72 h post-transfection and quantified relative to β-actin. (e) Immunostaining of primary LEC cultured in complete medium for 72 h after transfection with control or Fgfr1 siRNA revealed efficient reduction in FGFR1 protein levels. Scale bars represent 100 µm. (f) FGFR1 is important for LEC proliferation. Primary LEC were cultured for 24 h prior to treatment with control or Fgfr1 siRNA. LEC proliferation was measured by counting cells 72 h post-transfection. Data show mean ± s.e.m. Data are derived from 2 independent cell isolations, each prepared from multiple litters of embryos and multiple transfections per isolation (n = 11). ***P<0.001. (g) Primary LEC were cultured in EGM-2MV (complete media, CM) for 24 h prior to treatment with SU5402 (10 µM) for 72 h. LEC proliferation was measured using the CellTiter 96® AQueous One Solution Cell Proliferation Assay (Promega). Data shown represent mean ± s.e.m. and are derived from 3 independent cell isolations prepared from multiple litters of embryos and multiple replicates of each treatment (n = 14). *P<0.05.

