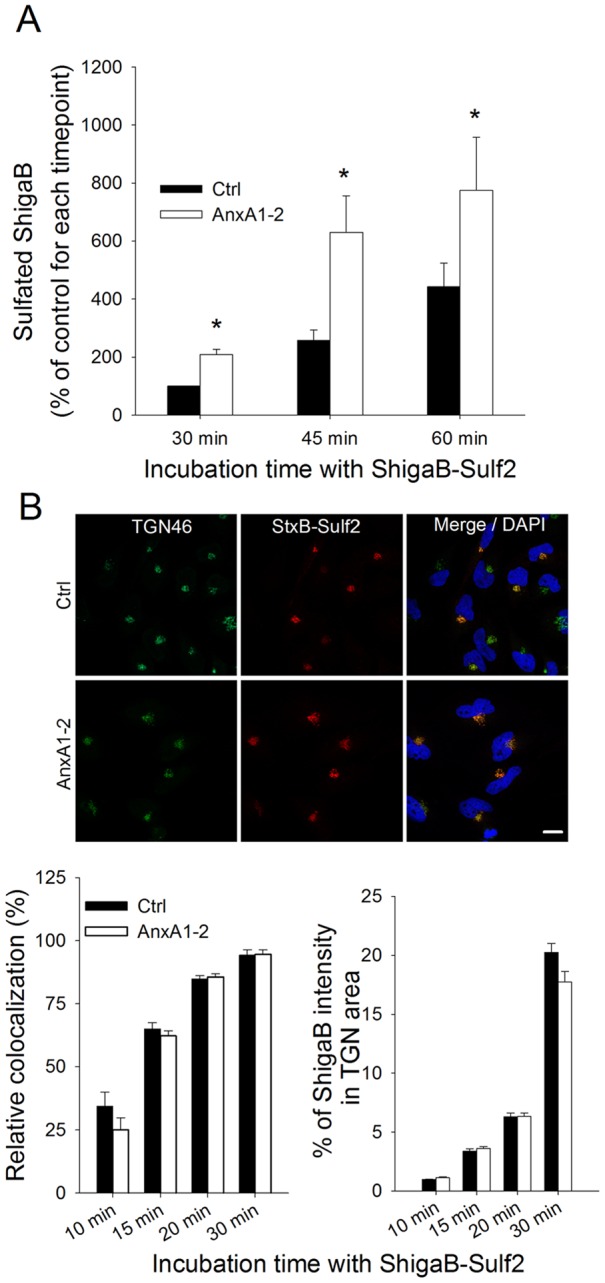
Figure 3. Time course of ShigaB sulfation in annexin A1 or A2 depleted cells.

(A) HeLa cells transfected with control or annexin A1 siRNA for 72 h were analyzed for the amount of ShigaB being sulfated at different time points after addition of StxB. Sulfation data are plotted as percentages of the amount of sulphated ShigaB after 30 min incubation with control siRNA treated cells. Black and white bars represent sulfation of ShigaB in control and annexin A1 siRNA treated cells, respectively. Data presented are the average of 3–4 independent experiments, each performed in parallel, error bars indicating standard error of the mean, *p<0.05; **p<0.005 indicates statistically significant change. (B) After the same treatment as in (A), cells were fixed and stained with antibodies against TGN46 and ShigaB. Top panel shows representative confocal pictures for 30 min incubation with StxB, scale bars 20 μm. Left graphic shows quantification of amount of ShigaB colocalized with TGN46. In the right graphic, mean intensity of ShigaB in the Golgi area for the same representative experiment is plotted as percentage of mean intensity in the whole cell. Data presented are the average of at least 35 cells per condition. Quantifications where obtained with ImageJ software, error bars indicating standard error of the mean.
