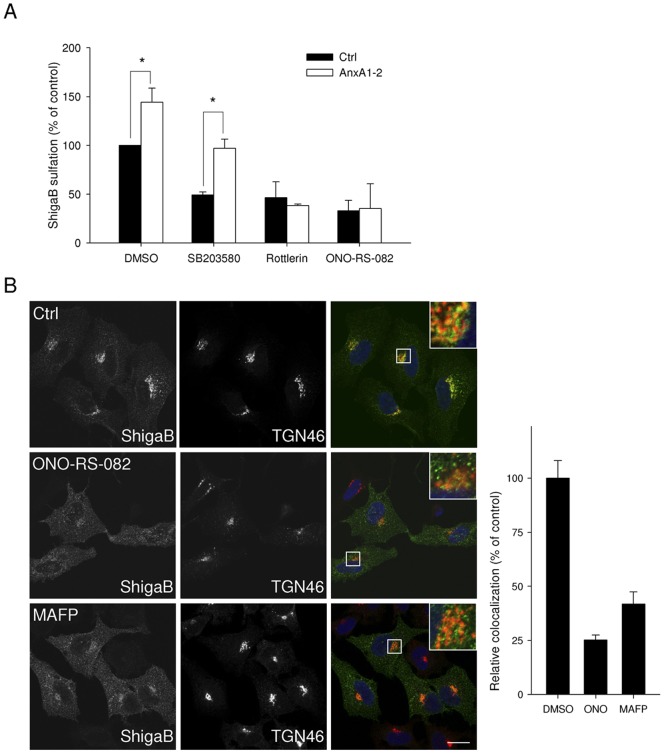
Figure 4. Stx transport in annexin A1 depleted cells is regulated by PKCδ and PLA2.
(A) Golgi transport of Shiga toxin was evaluated as described in materials and methods by quantification of sulfated ShigaB in HeLa cells transfected with siRNA against annexin A1 or non targeting siRNA, pretreated with the indicated inhibitors. Data from Stx sulfation are plotted as percentages of the value obtained for HeLa cells transfected with control siRNA and treated with DMSO. The white and black bars represent ShigaB-sulf2 sulfation for control and annexin A1 knockdown cells respectively. Data presented are the average of 3 independent experiments, each performed in parallel, error bars indicating standard error of the mean. *p<0.05 indicates statistically significant change between annexin A1 knockdown cells and the corresponding control siRNA treated cells. (B) After treatment with either 5 µM ONO-RS-082 for 30 min or 30 µM MAFP for 1 h, HeLa cells were incubated for 30 min with ShigaB before fixation and staining as indicated in the materials and methods section with antibodies against TGN46 and ShigaB. Panel shows representative confocal pictures, scale bars 20 μm. Graphic shows quantification of amount of ShigaB colocalized with TGN46 in one representative experiment plotted as percentage of control condition. Data presented for one representative experiment (n = 3) are the average of at least 30 cells per condition. Quantifications were obtained with Zen 2009 software from Zeiss, error bars indicating standard error of the mean.

