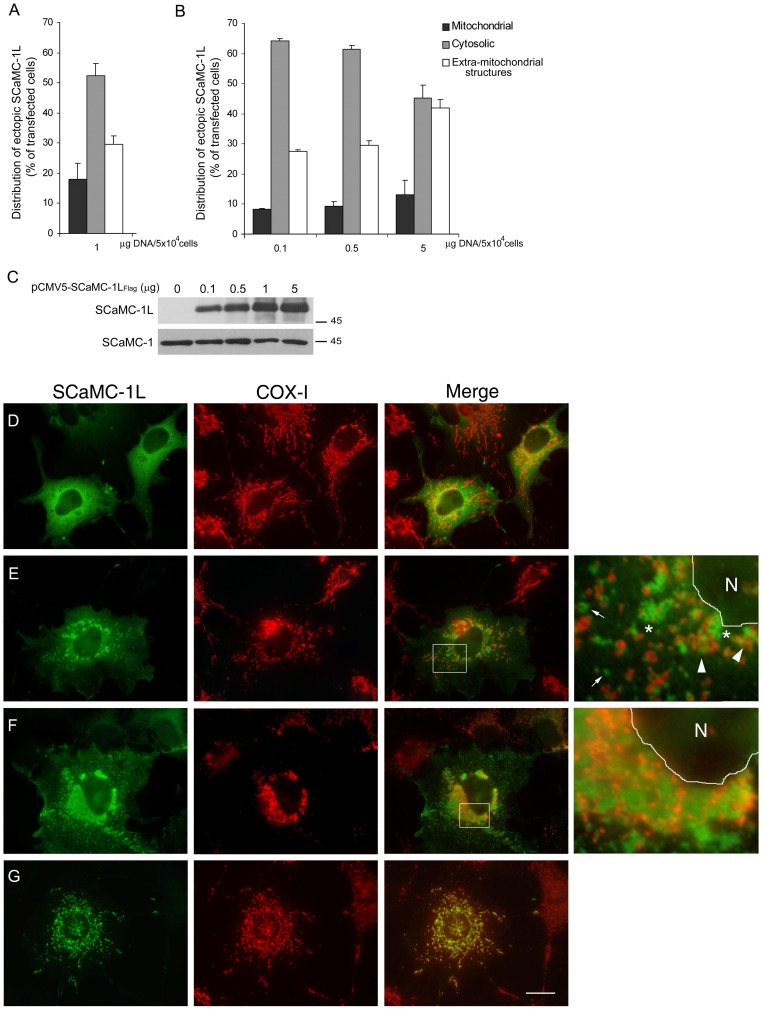
Figure 6. Expressed SCaMC-1L shows different intracellular patterns in COS-7 cells.
Quantitative assessment of SCaMC-1L distribution in COS-7 cells. The percentage of SCaMC-1L-expressing cells showing cytosolic, mitochondrial or extra-mitochondrial patterns were analyzed using one µg of DNA (A) or with different DNA concentrations (B). Intracellular pattern was determined in parallel transfections by co-staining with anti-SCaMC-1L and anti-COX-I, as mitochondrial control, and the distribution of SCaMC-1L-signals were examined by visual inspection under a fluorescent microscope. Two hundred cells were analyzed for each transfection assay. Data are the mean ± SEM of three independent experiments. (C) The expression levels of SCaMC-1L at the different plasmid concentrations used were determined by western blot. Five µg of total protein was loaded in each lane. As loading control, SCaMC-1 levels was analyzed (D–F) Representative images of SCaMC-1L-expressing COS-7 cells showing the different intracellular patterns observed; cytosolic (D) mitochondrial (G) and disperse (E) or perinuclear SCaMC-1L extra-mitochondrial aggregates (F). Mitochondrial co-localization was determined by double staining with anti-SCaMC-1L and anti-COX-I antibodies as described in Figure 2, corresponding merge panels are also shown. Scale bar, 20 µm. Insets show higher magnification (600×) of the indicated areas in the merge panels, in both the nuclear area (N) is delimited.

