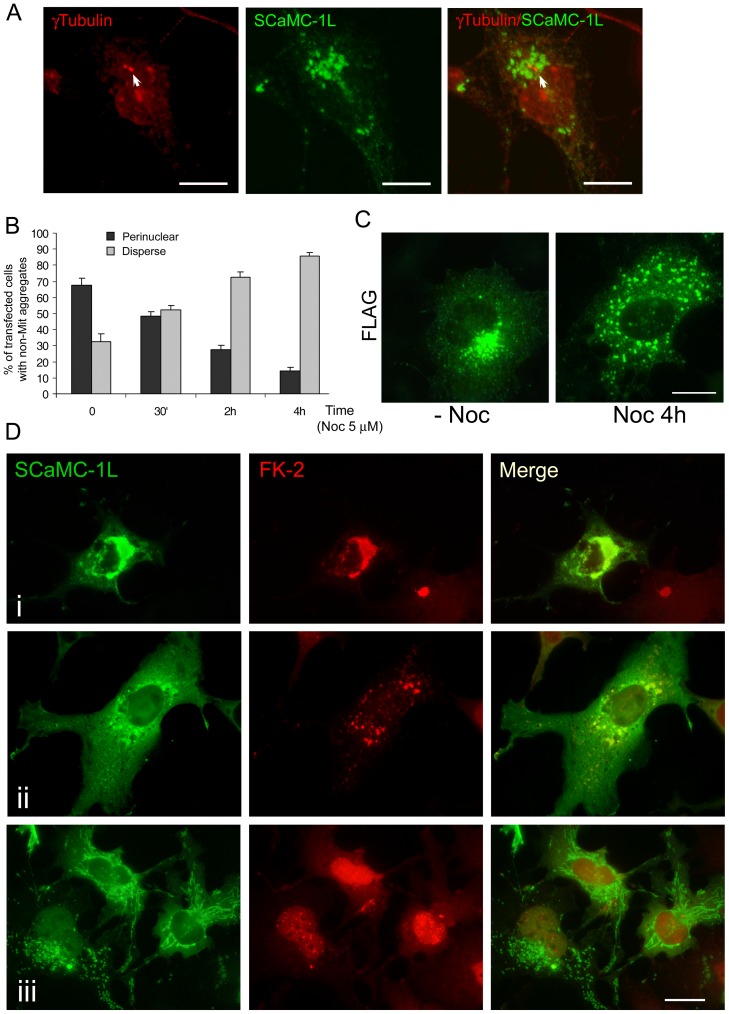
Figure 7. Perinuclear SCaMC-1L-positive aggregates show aggresomal features.
(A) Perinuclear SCaMC-1L aggregates (green) colocalize with γ-Tubulin signals (red) at MTOC (indicated by an arrow). (B) Perinuclear SCaMC-1L aggregates formation depends on microtubule network integrity. COS-7 cells were transfected with SCaMC-1L expression vector and 24 h later incubated with 5 µM nocodazole (Noc) during the indicated time. Cells were then fixed and processed to detect SCaMC-1L distribution by immunofluorescence with anti-FLAG antibody. Only cells showing extra-mitochondrial structures were taken into account. The percentage of SCaMC-1L expressing-cells showing perinuclear and disperse aggregates at different times of Noc incubation was determined. The distribution pattern was scored in at least two hundred cells at each time point. Results are the mean ± SEM of three independent experiments. (C) Representative images of cells showing perinuclear (without Noc, -Noc) and dispersed (after incubation with Noc for 4 h, Noc 4 h) SCaMC-1L aggregates. Incubation with Noc only causes the dispersion of perinuclear aggregates, scattered SCaMC-1L-positive structures are still detected after the treatment. (D) SCaMC-1L aggregates are stained with anti-ubiquitin (FK-2) antibodies. Images of SCaMC-1L transfected cells with anti-FLAG antibody (green) showing perinuclear (i) and disperse aggregates (ii), and mitochondrial distribution (iii) and their corresponding co-staining with FK-2 (red). Merged panels are also shown. Scale bars, 20 µm.

