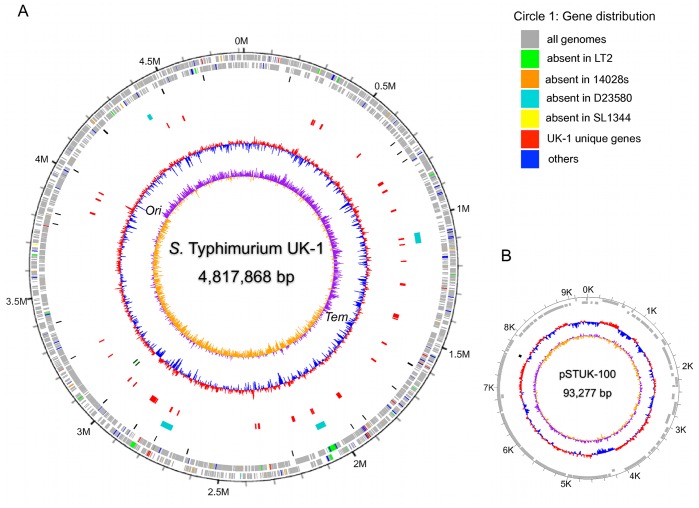
Figure 1. Genome atlas of Salmonella enterica serovar Typhimurium UK-1.
(A) The chromosome. Base pairs are indicated outside the outer circle. The circles represent the following (from outside to inside): Circle 1 shows the distribution of predicted ORFs in the leading and lagging strands (see details in the color legend for Circle 1). Circle 2 shows the UK-1 pseudogenes (black, single circle). Circle 3 shows the phage regions in UK-1 (Cyan, single circle). Circle 4 shows the genomic islands predicted by IslandViewer [98] (red, single circle). Circle 5 displays the GC content of the genome (red: high GC content, purple: low GC content). Circle 6 displays GC skew ([G+C]/[G−C]) plot. (B) The UK-1 plasmid pSTUK-100 genome. Base pairs are indicated outside the outer circle. From outside to inside: genes predicted in the plasmid genome (two circles; all ORFs are shown in grey since there were no unique genes found in the pSTUK-100 genome.), pseudogene(s) identified in pSTUK-100 (black, single circle), GC content of the plasmid genome (red: high GC content, purple: low GC content), and GC Skew Plot. For the GC content and GC skew analysis, we applied a sliding window of 1,000 bp with an overlap of 500 bp. The atlas was created using GenomeViz software [99].

