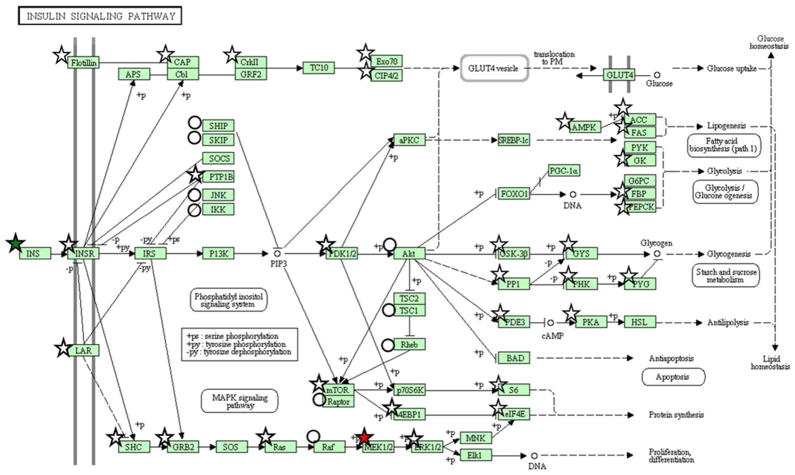
Figure 3.
Proteome coverage of the KEGG ‘Insulin Signaling’ pathway. Proteins marked by stars and circles indicate identification by two or more unique peptides or a single unique peptide, respectively. Symbols are colored to indicate direction of observed abundance change (15 mM versus 5 mM) after 24 h of incubation based upon significance by the G-test statistic: red (up-regulation), green (down-regulation), or white (no change).

