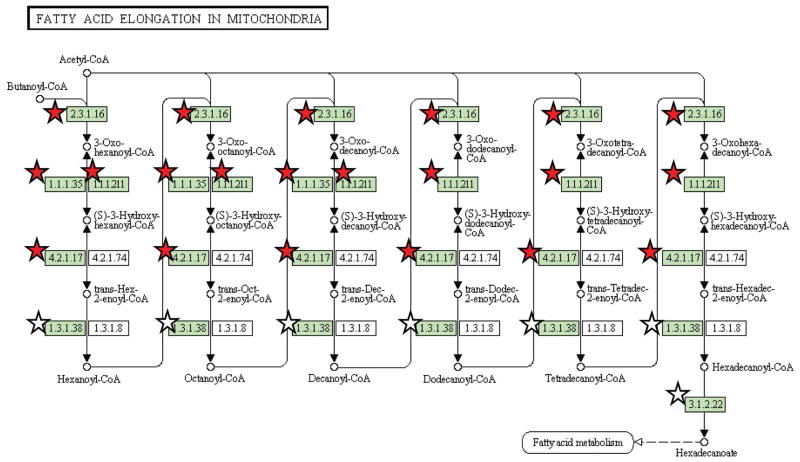
Figure 5.
Proteome coverage of the KEGG ‘Fatty acid elongation in mitochondria’ pathway. Stars represent proteins identified by two or more unique peptides. Symbols colored red indicate proteins deemed to have significant differential abundance (by G test statistic) after 24 h of high glucose incubation.

