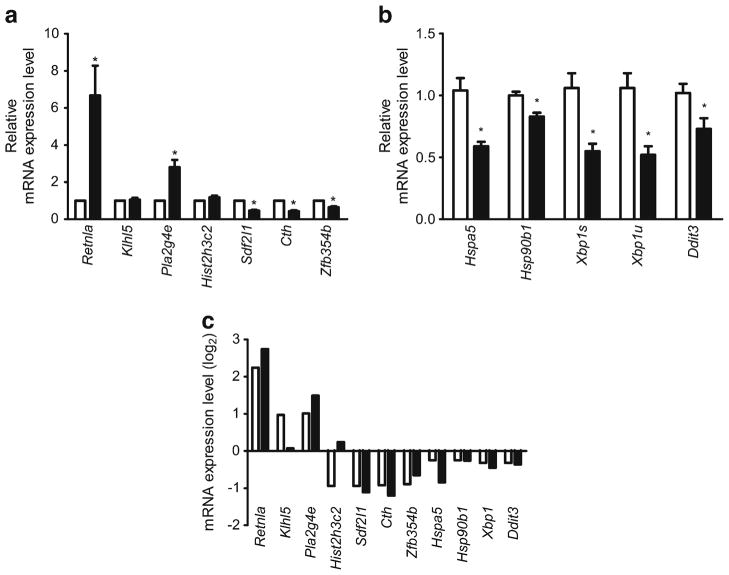
Fig. 2.
RT-PCR verification of the expression levels of the 24 week DEGs. Relative mRNA expression levels (FC) in db/db (black bars) compared with db+ (white bars) mice of (a) seven selected DEGs (>1.85 FC) and (b) four ER stress-related DEGs: Hspa5, Hsp90b1, Xbp1 (spliced [s] and unspliced [u]), and Ddit3. (c) The log2 transformation of the relative mRNA expression levels of all 11 DEGs selected for RT-PCR (black bars); 10 of the 11 parallel the direction of changes in the microarray (white bars). *p<0.05 based on t test; n=6

