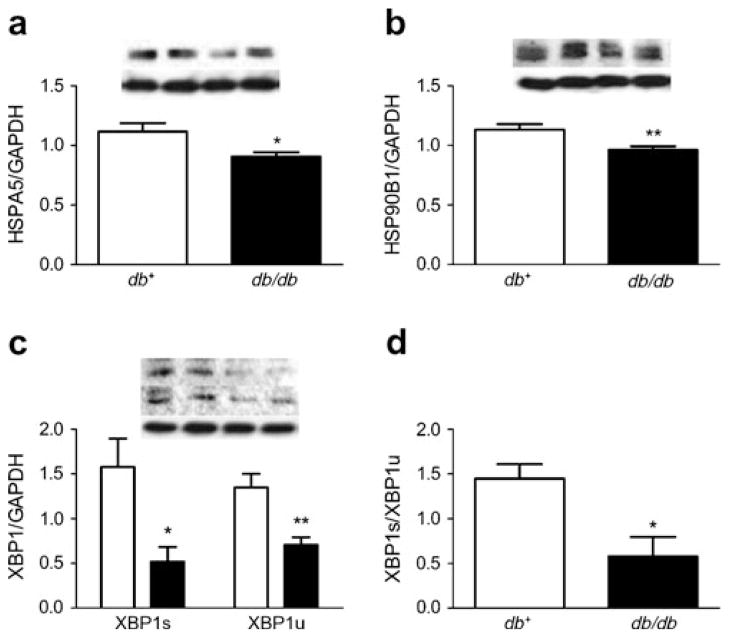
Fig. 3.
ER stress response was assessed in diabetic mice at 24 weeks by western immunoblotting. Representative blot and densitometry in the db+ (left two lanes) and db/db (right two lanes) mice; (a) HSPA5, (b) HSP90B1 and (c) XBP1s (upper blot) and XBP1s (centre blot). The values represent the ratio normalised to GAPDH (lower blot), the loading control. (d) The ratio of XBP1s to XBP1u in db+ (white bars) and db/db (black bars) mice. *p<0.05 and **p<0.01 based on t test; n=10 for db+ and n=11 for db/db mice

