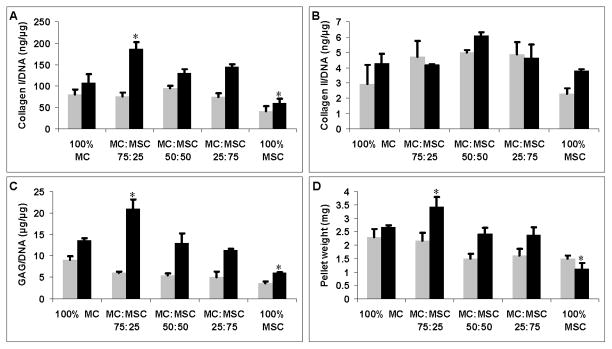
Figure 2.
ECM production normalized to DNA content and pellet weights of each group treated with (black bars) or without TGFβ (grey bars). A: Soluble collagen type I production normalized to DNA content (ng/μg). B: Soluble collagen type II production normalized to DNA content (ng/μg). C: GAG production normalized to DNA content (μg/μg). D: Cell pellet weight (mg). Asterisks indicate statistical significance of assigned groups (* p < 0.05) (n = 3).

