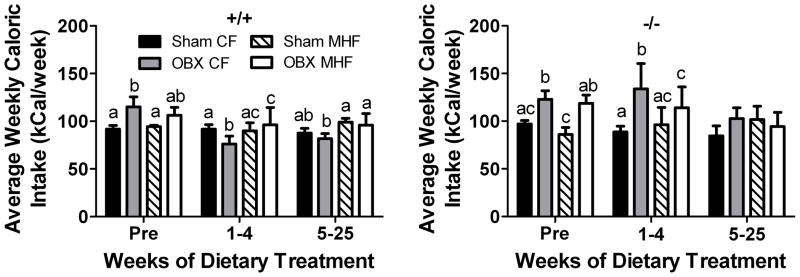
Figure 3.
Olfactory bulbectomy transiently increases caloric intake. Bar graph of average weekly caloric intake of (A) +/+ and (B) −/− mice following olfactory bulbectomy or sham surgery (sham). Diet treatments and abbreviations as in Figure 1. Treatment week Pre represents the caloric intake of the animals the week before the feeding treatment began and therefore all animals were receiving CF-diet. Values represent mean ± SEM, n=5–8. Letters indicate significant differences as in Figure 2, as determined by a two-way analysis of variance (2-way ANOVA; treatment vs. diet for each time interval) at the 95% confidence interval, followed by a Bonferroni post hoc test.

