
Fig. 3.
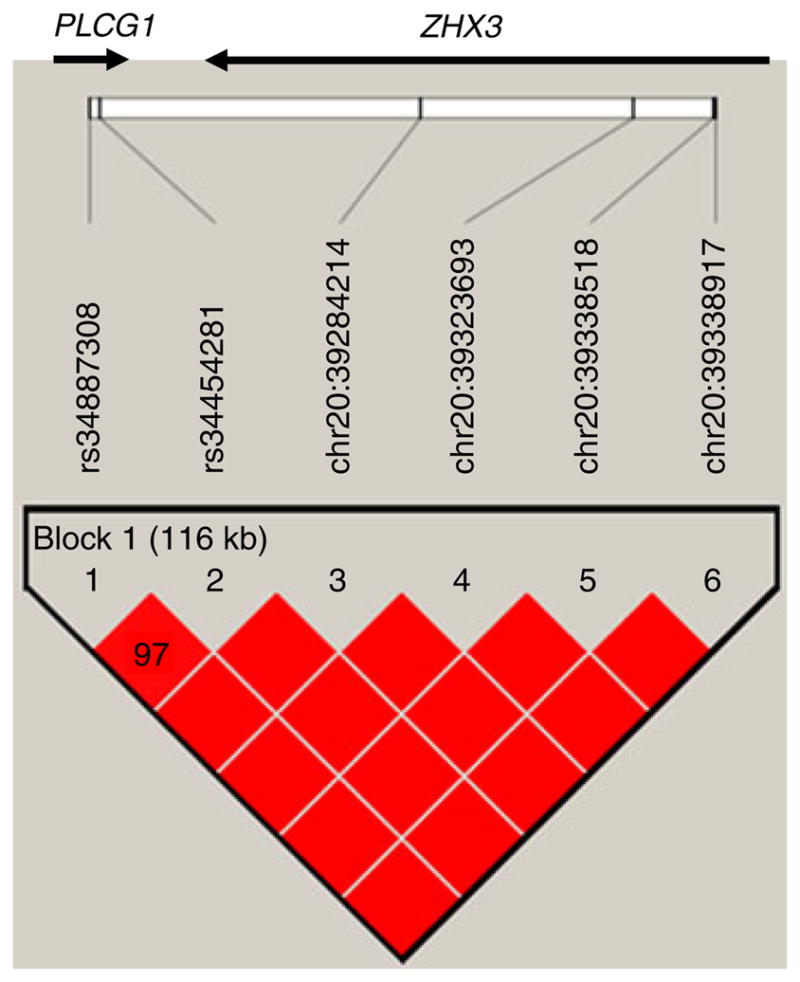
Gene and linkage disequilibrium plot for the chromosome 20 SNPs associated with insulin clearance. Genes are indicated by arrows (arrow size not to scale). The locations of the genotyped SNPs relative to the genes are indicated. The linkage disequilibrium plot beneath the genes displays D′ values (%) for each pair of SNPs in the box at the intersection of the diagonals from each SNP. The bright red blocks indicate D′ = 1 (100%) for the corresponding pair of variants with an LOD score of ≥2. All intragenic SNPs are intronic. SNPs that do not have rs numbers are indicated by genomic coordinates (NCBI Genome Build 36.3, www.ncbi.nlm.nih.gov/genome/guide/human/release_notes.html)