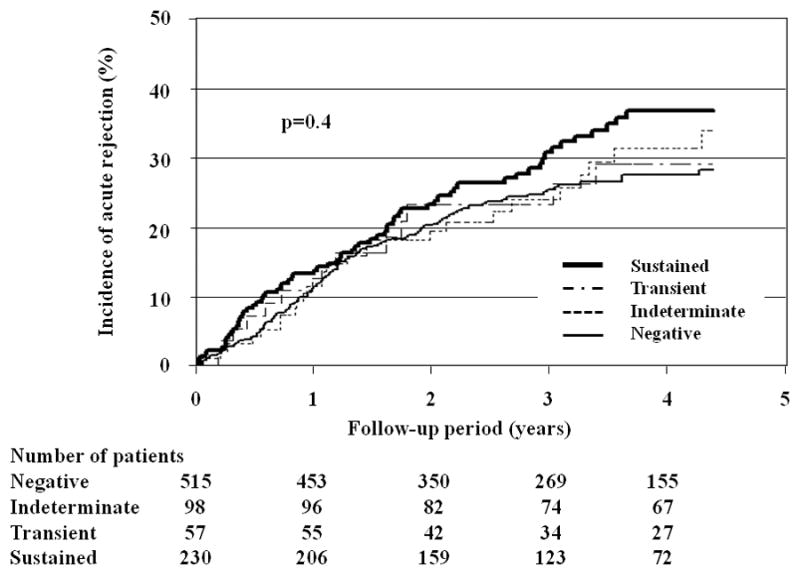
Figure 1.

Kaplan-Meier curves showing the incidence of acute rejection in different categories of patients classified by viral status. The curves were truncated at 4.3 years, a time period that corresponds to the 75 percentile of available graft follow-up period.
