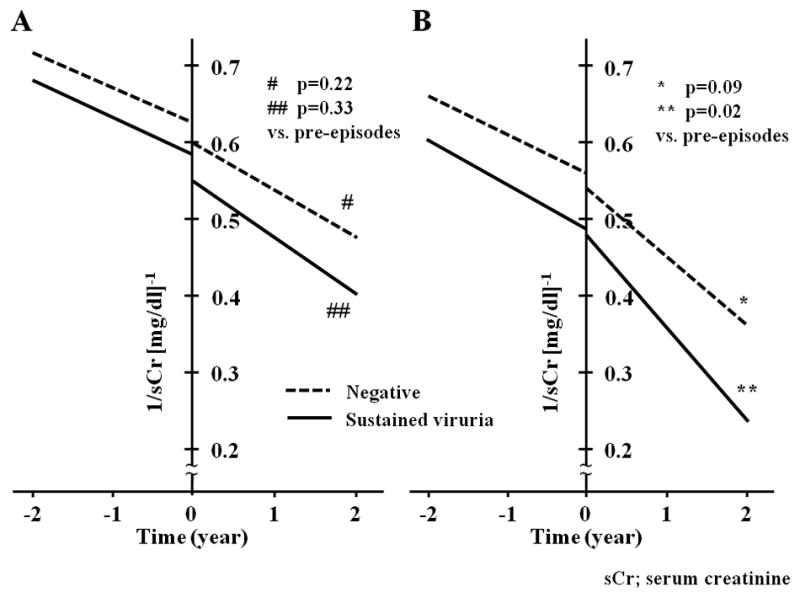
Figure 2.

Changes in the slope of serum creatinine in patients with documented acute rejection. Regression lines based on the mean Y-intercept and mean slope of reciprocal serum creatinine are drawn separately for rejection episodes that occurred between 1–2 years (A) or later than 2 years post-transplantation (B). The vertical line at time zero corresponds to the time of biopsy which documented acute rejection. Patients with sustained viruria are represented by the continuous line, while those negative for viruria are depicted by a dashed line. It can be observed that rejection episodes occurring >2 years post-transplant in patients with sustained viruria were associated with accelerated deterioration of graft function (slope −0.058±0.076 before vs. −0.11±0.13 [mg/dl]−1/year after rejection, p=0.02). Rejection in patients without viruria also appeared to have a similar detrimental effect, but it did not reach statistical significance (−0.051±0.055 vs. −0.092±0.14 [mg/dl]−1/year, p=0.09). The mean y-intercept of the slope of reciprocal serum creatinine in sustained viruria patients prior to occurrence of rejection was lower than that observed in the BKV negative group (0.49±0.14 vs. 0.57±0.17 [mg/dl]−1, p=0.02), indicating worse graft function at the time of diagnosis of rejection. The aforementioned differences were not seen on analysis of rejection episodes occurring between 1–2 years post-transplantation.
* p=0.09 slope of BKV negative patients after (−0.092±0.14 [mg/dl]−1/year) versus before (−0.051±0.055 [mg/dl]−1/year) rejection episodes (paired t-test) ** p=0.02 slope of sustained viruria patients after (−0.11±0.13 [mg/dl]−1/year) versus before (−0.058±0.076[mg/dl]−1/year) the rejection episode (paired t-test)
[Explanatory note for Figure 2: The plotted data is derived from a mean of 16±9 serum creatinine measurements before and 13±8 measurements after each rejection episode analyzed (minimum of three measurements in each case spanning a period of 3 or more months). Acute changes in serum creatinine triggered by the rejection episode were excluded from analysis. Rejection episodes that led to graft loss within 3 months (12 in sustained viruria group and 6 in BKV negative group) were also considered to be unsuitable for this analysis. After applying these criteria, data for calculation of slopes was available for 73 of 94 rejection episodes (77.7%) in sustained viruria and 90 of 107 episodes (84.1%) in the BKV negative group. The difference between early and late rejection episodes remained statistically significant after a linear mixed model was used to correct for multiple samples from the same patient.
