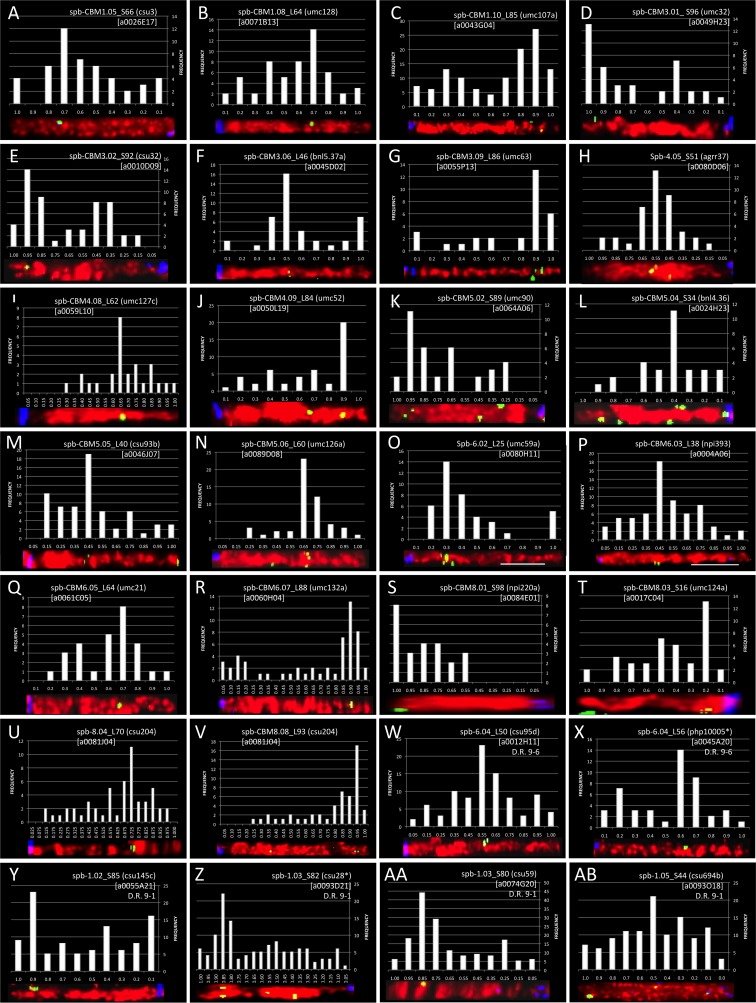
Fig. 3.
Histograms, locus names, and representative chromosome images for the FISH-mapped loci. Each panel displays the histogram used to delimit the FISH loci used to tabulate the mapping location, a straightened projection of a representative chromosome arm, and the resulting locus name. Images are organized according to chromosome and arm on which loci reside: chromosomes 1 (A–C), 3 (D–G), 4, (H–J), 5 (K–N), 6 (O–R), and 8 (S–V). Synteny-mapped loci are also shown for chromosomes 1 (W–Z) and 6 (AA, AB). Asterisks indicate FISH mapping of sorghum BACs in regions where the duplicate locus has been lost

