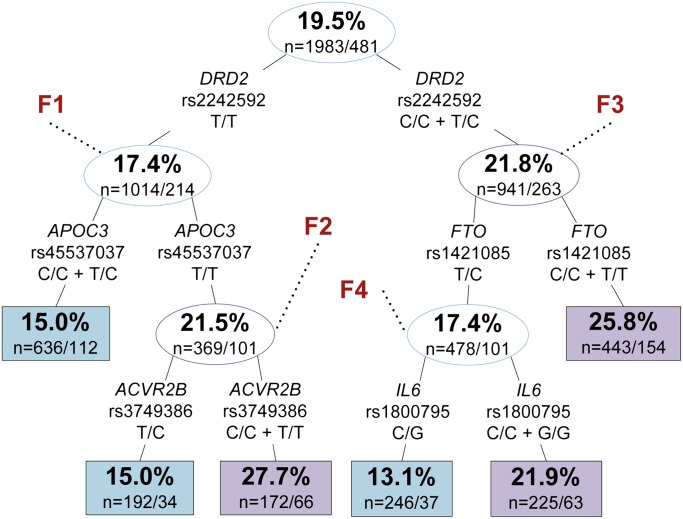
Figure 2.
Recursive partitioning tree of Composite International Diagnostic Interview–Short-Form depression in women of the Wisconsin Longitudinal Study. Upper and lower numbers in nodes represent the percentage of participants with depression and the number of controls/cases in that node, respectively. Blue and purple boxes/circles indicate lower and higher rates of depression relative to the primary node, respectively. Split information indicates gene, single nucleotide polymorphism (SNP), and genotype criteria, respectively. F1–F4 are subsets referenced in table 1. Sensitivity: 0.607, specificity: 0.563, accuracy: 0.572. Due to missing genotype information, we lose approximately 1.4% of participants per split.

