Abstract
The objective of this study was to determine the regiospecificity of the important uridine diphosphate glucuronosyltransferase (UGT) isoforms responsible for the glucuronidation of flavones and flavonols. We systematically studied the glucuronidation of 13 flavonoids (7 flavones and 6 flavonols, with hydroxyl group at C-3, C-4’, C-5, and/or C-7 positions in flavonoid structure) at a substrate concentration of 10μM by 8 recombinant human UGT isoforms mainly responsible for metabolism of flavonoids, UGT 1A1, 1A3, 1A6, 1A7, 1A8, 1A9, 1A10 and 2B7. At 10μM substrate concentration, different UGT isoforms gave different regiospecific glucuronidation patterns. UGT1A1 equally glucuronidated 3-O (glucuronic acid substituted at C-3 hydroxyl group), 7-O and 4’-O, whereas UGT1A8 and 1A9 preferably glucuronidated only 3-O and 7-O positions. UGT1A1 usually showed no regiospecificity for glucuronidating any position, whereas, UGT1A8 and UGT1A9 showed dominant, moderate or weak regiospecificity for 3-O or 7-O position, depending on the structure of the compound. UGT1A3 showed dominant regiospecificity for 7-O position, whereas 1A7 showed dominant regiospecificity for 3-O position. We also showed that the glucuronidation rates of 3-O and 7-O positions in flavones and flavonols were affected by the addition of multiple hydroxyl groups at different positions as well as by the substrate concentrations (2.5, 10 and 35μM). In conclusion, regiospecific glucuronidation of flavonols was isoform- and concentration- dependent, whereas flavones were dominantly glucuronidated at 7-O position by most UGT isoforms. We also concluded that UGT1A3 and UGT1A7 showed dominant regiospecificity for only 7-O and 3-O position, respectively. UGT1A8 and UGT1A9 showed moderate or weak preference on glucuronidating position 3-O over 7-O position, whereas other UGT isoforms did not prefer glucuronidating any particular positions.
Keywords: Regiospecificity, UGT isoforms, glucuronidation, flavonoids
INTRODUCTION
Uridine diphosphate glucuronosyltransferases (UDP-glucuronosyltransferases or UGTs) utilize uridine diphospho-glucuronic acid (UDPGA) as cofactor and transfer glucuronic acid to the usually lipophilic substrates, forming hydrophilic conjugates called glucuronides. Substrates of UGTs include endogenous compounds such as steroids, bile acids, bilirubin, hormones, dietary constituents like flavonoids, xenobiotics such as morphine and valproic acid, the products of phase I metabolism, and environmental toxins and carcinogens such as 2-Amino-1-methyl-6-phenylimidazo[4,5-b]pyridine (PhIP) (1-3). UGT-catalyzed glucuronidation reactions are responsible for 35% of all drugs metabolized by phase II enzymes (4). Despite the important role of UGTs in the metabolism of drugs, environmental chemicals and endogenous compounds, the structural features of these enzymes responsible for substrate binding and formation of regioselective glucuronides remain poorly understood (5, 6).
Flavonoids are polyphenolic compounds with several hydroxyl groups on heterocyclic skeleton of flavan(2-phenylbenzopyrone). Therefore, conjugations of glucuronic acid mainly occur at different hydroxyl groups and O-glucuronides are formed (3). However, there is very limited information available in literature on the regiospecificity of glucuronidation of compounds in general and flavonoid in specific. The regiospecific glucuronides of certain flavonoids have shown to exhibit different pharmacological actions in vivo (7, 8). For example, quercetin,7-O-G had stronger antioxidative property than quercetin,3-O-G (8).
Also, it has been proposed that glucuronides in systemic circulation or after uptake into an organ such as liver, intestine and neutrophils may hydrolyze back into aglycone by β-glucuronidase enzyme for pharmacological action. However, the rate of flavonoid glucuronides hydrolysis depends on the position of conjugation, which could affect the subsequent re-conjugation rate (9, 10). Therefore, it becomes important to understand the regiospecificity of various UGT isoforms, as based on different expression levels of UGTs in various metabolic organs and mode of administration of drug, the exposure of regiospecific glucuronides to an organ may differ extensively.
Previously, we have shown that certain UGT isoforms were important for the glucuronidation of most flavonoids from different sub-classes (11-13). However, different UGT isoforms showed differences in their rate and position of glucuronidation of flavones and flavonols (12). Among the various UGT isoforms expressed in liver, UGT1A1, 1A3, 1A9 and 2B7 are the most important isoforms of our interest, based on the published expression levels of UGT isoforms in liver (14) as well as the rate of glucuronidation of various flavonoids by UGT isoforms (11, 12). UGT1A6 is another hepatic isoform which is highly expressed in Caco-2 cell lines (15), extensively used for disposition studies. Among extra-hepatic isoforms, UGT1A7, 1A8 and 1A10 are the most important isoforms responsible for glucuronidation of flavonoids (11, 12).
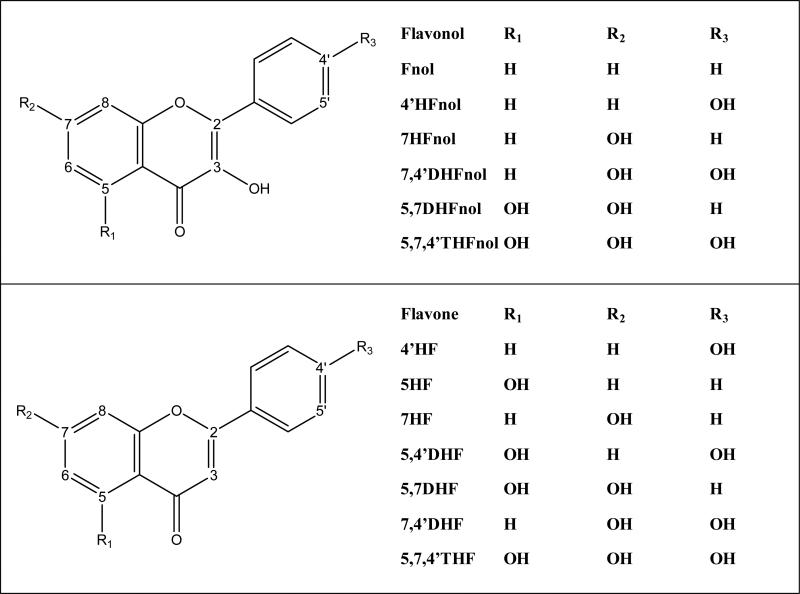
Therefore, we decided to study all major UGT isoforms for the preference of position of glucuronidation using 13 flavonoids (7 flavones and 6 flavonols) (Figure 1) with hydroxyl groups at C-3, C-4’, C-5 and C-7 positions. Compounds from flavone and flavonol sub-classes were chosen for the study due to the commercial availability of congeneric compounds with hydroxyl group(s) at different positions on the same structural backbone in these sub-classes of flavonoids. The purpose of this study was to give insight into regiospecificity of various UGT isoforms, and predict the relative occurrence of various regiospecific glucuronides of flavonoids based on expression levels of various metabolic organs such as liver and intestine.
Figure 1.
Structure of flavonols and flavones used in the study
EXPERIMENTAL SECTION
Materials
3-hydroxyflavone or flavonol (Fnol), 3,4’-dihydroxyflavone or 4’-hydroxyflavonol (4’-HFnol), 3,7-dihydroxyflavone or 7-hydroxyflavonol (7-HFnol), 5,4’-dihydroxyflavone (5,4’DHF), 5,7-dihydroxyflavone (5,7DHF), 7,4’-dihydroxyflavone (7,4’DHF), 3,7,4’-trihydroxyflavone or resokaempferol or 7,4’-dihydroxyflavonol (7,4’DHFnol) and 3,5,7-trihydroxyflavone or galangin or 5,7-dihydroxyflavonol (5,7DHFnol), 5,7,4’-trihydroxyflavone or apigenin (Api or 5,7,4’THF), 3,5,7,4’-tetrahydroxyflavone or kaempferol or 5,7,4’-trihydroxyflavonol (5,7,4’THFnol or Kamp), were purchased from Indofine Chemicals (Somerville, NJ). 8 commercially available recombinant human UGT isoforms (Supersomes), UGT 1A1, 1A3, 1A6, 1A7, 1A8, 1A9, 1A10, and 2B7, were purchased from BD Biosciences (Woburn, MA). Uridine diphosphoglucuronic acid (UDPGA), alamethicin, D-saccharic-1,4-lactone monohydrate, magnesium chloride, and Hanks’ balanced salt solution (powder form) were purchased from Sigma-Aldrich (St Louis, MO). All other materials (typically analytical grade or better) were used as received.
Identification of position of glucuronidation in the structure of flavones and flavonols by UV shift method
The sites of glucuronic acid substitutions in flavones and flavonols were established based on the online UV spectral shift method, optimized and validated in our lab based on the published literature (16, 17). Briefly, substitution of a single hydroxyl group by glucuronic acid in the structure of flavone at a specific position would result in diagnostic shifts or no shift in λmax of Band I (300-380 nm) and/or Band II (240-280 nm) in the UV spectrum of the resulting glucuronide as compared to the UV spectrum of parent compound. Based on these differentiating diagnostic shifts for each position of glucuronidation, structure of a glucuronide can be estimated. The details of the method and its validation can be found in Singh et al. (2010) (18).
Methods
Solubility and stability of the tested flavonoids
Solubility and stability of the tested flavonoids were established at the experimental conditions. The results showed that these compounds were stable and soluble at the tested concentrations (not shown).
Glucuronidation activities of recombinant human UGTs
The incubation procedures for measuring UGTs’ activities were essentially the same as published before (19, 20). Briefly, incubation procedures using supersomes were as follows: (1) supersomes (final concentration ≈ in range of 0.013~0.053 mg of protein per mL as optimum for the reaction), magnesium chloride (0.88 mM), saccharolactone (4.4 mM), alamethicin (0.022 mg/mL), different concentrations of substrates in a 50 mM potassium phosphate buffer (pH 7.4), and UDPGA (3.5 mM, add last) were mixed; (2) the mixture (final volume ) 200 μL) was incubated at 37°C for a predetermined period of time (30 or 60 min); and (3) the reaction was stopped by the addition of 50μL of 94% acetonitrile/6% glacial acetic acid containing 100 μM of testosterone or 50 μM of 5-hydroxyflavone or formononetin as internal standard. Testosterone was used as internal standard for 4’HFnol, 7,4’THF, 7,4’DHFnol, 5,7,4’THF and 5,7,4’THFnol; formononetin for Fnol, 5,4’DHF, 5,7DHF and 5,7DHFnol; and 5-hydroxyflavone for 7HFnol. Three substrate concentrations, 2.5, 10 and 35 μM were used for the studying the UGT isoforms.
UPLC analysis of flavonoids and their glucuronides
We analyzed flavonoids and their respective glucuronides by using the following common method: system, Waters Acquity UPLC with photodiode array detector and Empower software; column, BEH C18, 1.7 μm, 2.1 × 50 mm; and injection volume, 10μL. Representative chromatograms were shown in Fig.S1 of Supporting Information
Quantification of glucuronides of flavonoids
The quantification of glucuronides of flavonoids was done using the standard curve of the parent compound with a correction factor for difference in extinction coefficient of the compound and its metabolites as shown in our previous publication (18). The correction factors were in the range of 0.5 (for 3-O-G of Fnol) to 2.5 (for 3-O-G for 7HFnol), as reported previously (18).
Confirmation of flavonoids glucuronide structure by LC MS/MS
Flavonoids and their respective glucuronides were separated by the same UPLC system but using slightly different chromatographic conditions because of mass spectrometer requirements. Here, mobile phase A was ammonium acetate buffer (pH 7.5) and mobile phase B was 100% acetonitrile with the gradient as follows: 0-2.0 min, 10–35% B, 2.0-3.0 min, 35–70% B, 3.2-3.5 min, 70–10% B, 3.5-3.7 min, 10% B. The flow rate was 0.5 mL/min. The effluent was introduced into an API 3200 Qtrap triple-quadrupole mass spectrometer (Applied Biosystem/MDS SCIEX, Foster City, CA) equipped with a TurboIonSpray™ source.
The mass spectrometer was operated in negative ion mode to perform the analysis of flavonoids and their respective glucuronides. The main working parameters for the mass spectrometers were set as follows: ion source temperature, 600°C; nebulizer gas (gas1), nitrogen, 40 psi; turbo gas (gas2), nitrogen, 40 psi; curtain gas, nitrogen, 20 psi; DP, -50 V; EP, -10V; CE, -30V; CXP, -3V and IS -4.5KV. Minor adjustments were then made for each flavonoid. Flavonoids mono-O-glucuronides were identified by MS and MS2 full scan modes.
The glucuronides were extracted by solid phase extraction from the glucuronidation experiment samples and re-constituted in small amount of 30% acetonitrile in water. The concentrated samples were then used to identify the glucuronides in UPLC/MS/MS.
Data analysis
Rates of metabolism in recombinant human UGT isoforms were expressed as amounts of metabolites formed per hour per mg protein or nmol/hr/mg.
Statistical analysis
One-way ANOVA or an unpaired Student's t-test (GraphPad Prism®, GraphPad software Inc., CA) with or without Tukey-Kramer multiple comparison (posthoc) tests was used to analyze the statistical significance among various data. The prior level of significance was set at 5%, or p<0.05.
RESULTS
Confirmation of flavones and flavonols glucuronides structure by LC-MS/MS
LC-MS/MS studies of the glucuronides of flavonoids revealed that only mono-glucuronide was formed and position-specific mono-glucuronide was identified below.
Position of glucuronides in the structure of flavones and flavonols by UV shift method
We determined the position of glucuronidation based on the diagnostic shift in λmax of Band I and Band II of UV spectra of glucuronides as shown in Figure S1 of Supporting Information.
For 4’HFnol, the first glucuronide was 4’-O-G while the second glucuronide was 3-O-G, whereas for 7HFnol, the first glucuronide was 3-O-G, while the second glucuronide was glucuronidated at position C-7 (Fig. S1 of Supporting Information). In case of 5,7DHFnol, the position of glucuronidation of first, second and third glucuronides were 3-O-G, 7-O-G, and 5-O-G, respectively (Fig. S1 of Supporting Information). In case of both 7,4’DHFnol and 5,7,4’THFnol (kaempferol), the position of glucuronidation of first, second and third glucuronides were 7-O-G, 4’-O-G, and 3-O-G, respectively (Fig. S1 of Supporting Information).
First and second glucuronide of 5,4’DHF was 5-O-G and 4’-O-G respectively. Similarly for 5,7DHF, the first glucuronide was 5-O-G, while the second glucuronide was 7-O-G (Fig. S1 of Supporting Information). In case of 7,4’DHF, the position of conjugation of first and second glucuronides were 7-O-G, 4’-O-G, respectively, whereas, only one quantifiable glucuronide was observed in case of 5,7,4’THF (apigenin), glucuronidated at C-7 (Fig. S1 of Supporting Information).
Regiospecificity of flavonoid glucuronidation by UGT isoforms
We studied the regiospecificity of flavonols and flavones glucuronidation, i.e. preference of glucuronidating a particular hydroxyl group position by UGT 1A1, 1A3, 1A6, 1A7, 1A8, 1A9, 1A10 and 2B7. For the ease of understanding the data, the regiospecificity here is randomly defined into four categories: dominant, moderate, weak and none. Dominant regiospecificity means that one hydroxyl group position in the structure is dominantly glucuronidated, such that the ratio of the most prevalent glucuronide to other glucuronide(s) is equal to or greater than 9:1. Moderate regiospecificity means the same ratio is equal to or more greater than 3:1 but less than 9:1. Weak regiospecificity means that the same ratio is equal to or more than 2:1 but less than 3:1, whereas no regiospecificity means that the same ratio is less than 2:1. All UGT isoforms were studied for their regiospecificity for each compound based into these random categories.
Flavonols
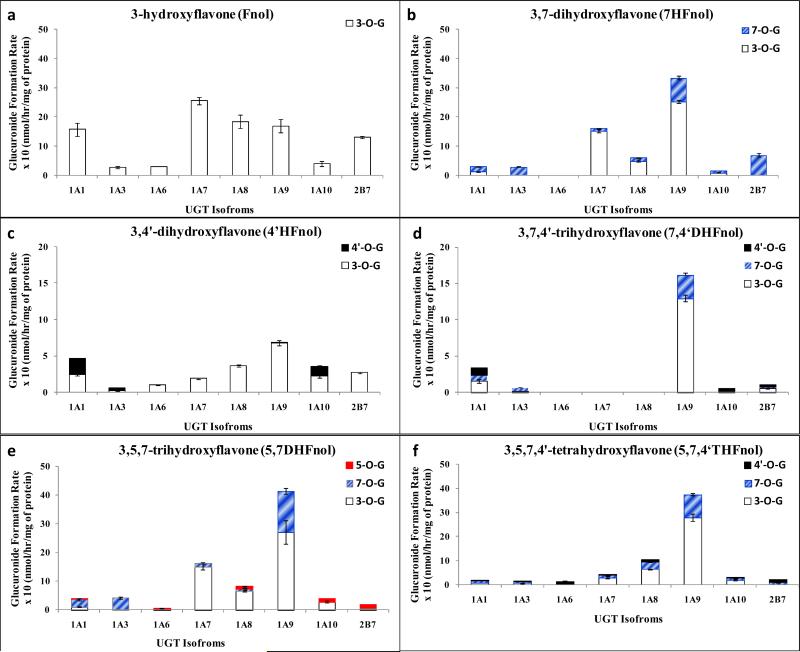
In general, most isoforms preferably glucuronidated 3-O position in the structure of flavonols, followed by glucuronidation of 7-O position, except 1A3, which exclusively preferred glucuronidation of 7-O position (Figure 2, Table 1). However, different isoforms might display different regiospecificity depending upon structure of compounds. Fnol was a universal substrate and could be metabolized by any of the 8 UGT isoforms tested (Fig. 2a). For 7HFnol, different isoforms showed great differences in their regiospecificity. UGT1A3 and 2B7 were dominantly regiospecific by glucuronidating hydroxyl group only at C-7 position, whereas UGT1A7 dominantly glucuronidated hydroxyl group at C-3 position. UGT1A8 and 1A9 showed moderate regiospecificity for 3-O position, whereas UGT1A1 and 1A10 showed no preference (Fig. 2b, Table 1).
Figure 2. Regiospecific glucuronidation of flavonols by UGTs.
Rate of glucuronidation of regiospecific glucuronides of Fnol (a), 4’HFnol (b), 7HFnol (c), 7,4’DHFnol (d), 5,7DHFnol (e) and 5,7,4’THFnol (f) with UGT 1A1, 1A3, 1A6, 1A7, 1A8, 1A9, 1A10 and 2B7. Flavonols (at 10 μM concentration) were incubated at 37 °C for 1 (or 0.5) hr with UGTs (using optimum final protein concentration ~ 0.25, 0.5 or 1 mg/ml). The amounts of each regiospecific mono-glucuronide formed were measured using UPLC. Rates of mono-glucuronide formation were calculated as nmol/hr/mg of protein. Each bar is the average of three determinations, and the error bars are the standard deviations of the mean (n=3). UGT stands for Uridine diphosphate glucuronosyltransferases).
Table 1.
Degree of regiospecificity (dominant, moderate, weak or no) of various UGT (uridine diphosphate glucuronosyltransferases) isoforms for glucuronidating flavones and flavonols. The position shown in bracket stands for major glucuronide. In case of di-hydroxyflavones and hydroxyflavonols, degree of regiospecificity was determined based on ratio of rates of formation of two glucuronides. In case of tri-hydroxyflavones, di-hydroxyflavonols and tri-hydroxyflavonols, degree of regiospecificity was determined based on ratio of rates of formation of two faster glucuronides.
| UGT Isoforms | Substrate Concentration (μM) | 4'HFnol | 7HFnol | 5,4'DHF | 5,7DHF | 7,4'DHF | 5,7DHFnol1 | 7,4'DHFnol1 | 5,7,4'THF2 | 5,7,4'THFnol1 |
|---|---|---|---|---|---|---|---|---|---|---|
| 1A1 | 2.5 | No (3-O, 4’-O) | Weak (7-O) | Dominant (4’-O) | Dominant (7-O) | Weak (7-O) | Weak (7-O) | No (3-O, 7-O) | Dominant (7-O) | Weak (7-O) |
| 10 | No (3-O, 4’-O) | No (3-O,7-O) | Dominant (4’-O) | Dominant (7-O) | Moderate (7-O) | Weak (7-O) | No (3-O, 7-O) | Dominant (7-O) | No (3-O, 7-O) | |
| 1A3 | 2.5 | Dominant (3-O) | Moderate (7-O) | Dominant (4’-O) | Dominant (7-O) | Dominant (7-O) | Dominant (7-O) | Dominant (7-O) | Dominant (7-O) | No (3-O, 7-O) |
| 10 | No (3-O, 4’-O) | Dominant (7-O) | Moderate (4’-O) | Dominant (7-O) | Dominant (7-O) | Dominant (7-O) | Weak (7-O) | Dominant (7-O) | No (3-O, 7-O) | |
| 1A6 | 2.5 | Dominant (3-O) | * | * | Moderate (7-O) | * | - | * | Dominant (7-O) | Moderate (3-O) |
| 10 | Dominant (3-O) | * | * | Moderate (7-O) | Dominant (7-O) | # | * | Dominant (7-O) | ## | |
| 1A7 | 10 | Dominant (3-O) | Dominant (3-O) | * | Dominant (7-O) | * | Dominant (3-O) | * | Dominant (7-O) | Weak (3-O) |
| 1A8 | 2.5 | Dominant (3-O) | Moderate (3-O) | Dominant (4’-O) | Dominant (7-O) | Dominant (7-O) | Dominant (3-O) | * | Dominant (7-O) | Weak (3-O) |
| 10 | Dominant (3-O) | Moderate (3-O) | Moderate (4’-O) | Dominant (7-O) | Moderate (7-O) | Moderate (3-O) | * | Dominant (7-O) | Weak (3-O) | |
| 1A9 | 2.5 | Dominant (3-O) | Moderate (3-O) | Dominant (4’-O) | Dominant (7-O) | Moderate (7-O) | Weak (3-O) | Moderate (3-O) | Dominant (7-O) | Moderate (3-O) |
| 10 | Dominant (3-O) | Moderate (3-O) | Dominant (4’-O) | Dominant (7-O) | Moderate (7-O) | No (3-O, 7-O) | Moderate (3-O) | Dominant (7-O) | Weak (3-O) | |
| 1A10 | 2.5 | No (3-O, 4’-O) | Weak (3-O) | Dominant (4’-O) | Dominant (7-O) | Dominant (7-O) | Dominant (3-O) | * | Dominant (7-O) | Moderate (3-O) |
| 10 | Dominant (3-O) | No (3-O, 7-O) | Dominant (4’-O) | Moderate (7-O) | No (7-O, 4’-O) | # | No (3-O, 7-O) | Dominant (7-O) | Weak (3-O) | |
| 2B7 | 10 | Dominant (3-O) | Dominant (7-O) | Dominant (4’-O) | Moderate (7-O) | * | # | Weak (3-O) | Dominant (7-O) | ## |
stands for ratio of rates of formation of 3-O and 7-O glucuronides.
stands for ratio of rates of formation of 5-O and 7-O glucuronides.
No glucuronidation was detected at any hydroxyl group.
Two faster glucuronides were 3-O and 5-O, instead of 3-O and 7-O.
Two faster glucuronides were 4’-O and 7-O, instead of 3-O and 7-O.
The highlighted cells in the table represent any change in regiospecificity with change from lower (2.5μM) to higher (10μM) substrate concentration.
For 4’HFnol, most isoforms showed dominant regiospecificity by glucuronidating almost only the 3-O position, except UGT1A1 and 1A3 which showed no regiospecificity and glucuronidated both hydroxyl groups at C-4’position and C-3 positions comparably (Fig. 2c, Table 1).
In case of 7,4’DHFnol, UGT1A1, 1A10 and 2B7 glucuronidated all the three hydroxyl groups, whereas 1A3 and 1A9 glucuronidated hydroxyl groups at C-3 and C-7 positions only (Fig. 2d). UGT1A1 and 1A10 showed no regiospecific preference for any position, whereas UGT1A9 and 2B7 showed moderate and weak regiospecific preference of glucuronidating 3-O than 7-O position. On the other hand, UGT1A3 showed weak regiospecific preference for 7-O over 3-O position (Fig. 2d, Table 1).
In case of 5,7DHFnol, position(s) and regiospecificity of glucuronidation varied a lot for different isoforms. (Fig. 2e). UGT1A3 was dominantly regiospecific for 7-O, whereas UGT1A7 was dominantly regiospecific for 3-O (Fig. 2e, Table 1). UGT 1A1 weakly preferred the glucuronidation of 7-O over 3-O position, whereas 1A8 and 2B7 moderately preferred the glucuronidation of 3-O and 5-O, respectively (Fig. 2e, Table 1). UGT1A9 and 1A6 did not show any regiospecific preference for any position, whereas 1A10 weakly preferred 3-O over 5-O (Fig. 2e, Table 1).
In case of 5,7,4’THFnol, 5-O position was not significantly glucuronidated by any isoform. UGT 1A1, 1A3, 1A7, 1A8 and 1A10 glucuronidated 3-O, 7-O and 4’-O, whereas 1A6 and 2B7 glucuronidated only 7-O and 4’-O and 1A9 glucuronidated only 3-O and 7-O positions (Fig. 2f). No isoforms showed any dominant or moderate regiospecificity for any position, except UGT1A6 which moderately preferred regiospecific glucuronidation of 4’-O over 7-O position (Fig. 2f, Table 1). UGT 1A1 and 1A3 showed no regiospecific preference between 3-O and 7-O, whereas 1A7, 1A8, 1A9 and 1A10 only weakly preferred 3-O position (Fig. 2f, Table 1).
In general, UGT1A1, 1A6, 1A10 and 2B7 did not show any dominant regiospecificity for any position, however in some cases, moderate or weak regiospecificity can be seen for glucuronidation of different positions of flavonols. UGT1A3 showed dominant regiospecificity for 7-O position, whereas 1A7 showed dominant regiospecificity for 3-O position. UGT1A8 and 1A9 preferably glucuronidated 3-O and 7-O positions only, with moderate or weak regiospecificity for 3-O position in most cases.
Flavones
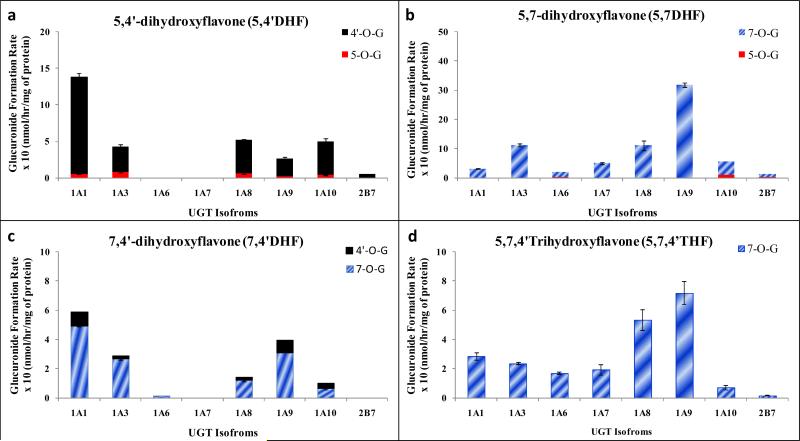
In general, most isoforms preferably glucuronidated 7-O position in the structure of flavones, followed by glucuronidation of 4’-O position to some extent (Figure 3). In case of 5,4’DHF, except UGT2B7, all metabolizing isoforms glucuronidated both hydroxyl groups at both C-5 and C-4’- though 4’-O was the preferred position of glucuronidation in all cases. UGT1A1, 1A9, 1A10 and 2B7 showed dominant regiospecificity, whereas, 1A3 and 1A8 showed moderate regiospecificity for 4’-O position (Fig. 3a, Table 1).
Figure 3. Regiospecific glucuronidation of flavones by UGTs.
Rate of glucuronidation of regiospecific glucuronides of 5,4’DHF (a), 5,7DHF (b), 7,4’DHF (c), and 5,7,4’THF (d) with UGT 1A1, 1A3, 1A6, 1A7, 1A8, 1A9, 1A10 and 2B7. Flavones (at 10 μM concentration) were incubated at 37 °C for 1 (or 0.5) hr with UGTs (using optimum final protein concentration ~ 0.25, 0.5 or 1 mg/ml). The amounts of each regiospecific mono-glucuronide formed were measured using UPLC. Rates of mono-glucuronide formation were calculated as nmol/hr/mg of protein. Each bar is the average of three determinations, and the error bars are the standard deviations of the mean (n=3). UGT stands for Uridine diphosphate glucuronosyltransferases).
In 5,7DHF, UGT1A1, 1A3, 1A7, 1A8 and 1A9 glucuronidated 7-O position only and hence showed dominant regiospecificity towards 7-O position (Fig. 3b, Table 1). On the other hand, UGT1A6, 1A10 and 2B7 glucuronidated both 7-O and 5-O positions, and showed only moderate regiospecificity towards 7-O position (Fig. 3b, Table 1).
In case of 7,4’DHF, except UGT1A6, all metabolizing isoforms glucuronidated both hydroxyl groups at C-7 and C-4’ positions (Fig. 3c). UGT 1A3 and 1A6 showed dominant regiospecificity for glucuronidation of 7-O position, whereas UGT1A1, 1A8 and 1A9 showed only moderate regiospecificity for glucuronidation of 7-O position (Fig. 3c, Table 1). UGT1A10 did not show any regiospecificity and glucuronidated both positions comparably (Fig. 3c, Table 1). In case of 5,7,4’THF, all isoforms showed dominant regiospecific glucuronidation of hydroxyl group at C-7 position only (Fig. 3d, Table 1).
In summary, for flavones with hydroxyl group at C-7 position, most UGT isoforms showed either dominant or moderate regiospecificity for glucuronidating 7-O position over 4’-O and 5-O positions. In absence of hydroxyl group at C-7 position, most UGT isoforms showed either dominant or moderate regiospecificity for glucuronidating 4’-O position over 5-O position.
Regiospecificity of UGT isoforms for flavonoids glucuronidation
We studied in detail the regiospecific glucuronidation of flavonoids by hepatic (1A1, 1A3, 1A9, 2B7 and 1A6) and extra-hepatic (1A7, 1A8 and 1A10) UGT isoforms using flavonoids (at 2.5 and 10 μM) with hydroxyl group(s) at different position(s) i.e. 3-O, 4’-O, 5-O and 7-O.
UGT1A1
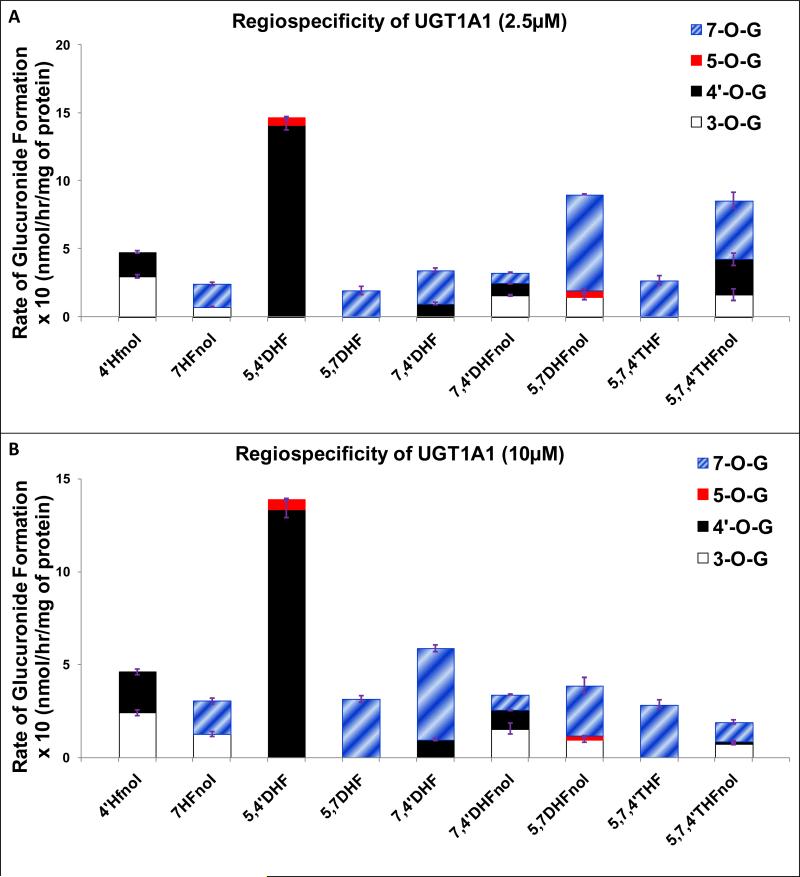
UGT1A1 was able to effectively glucuronidate 3-O, 4’-O and 7-O position in selected flavones and flavonols, but 5-O position was not favored both at 2.5 and 10 μM substrate concentrations (Fig. 4A-4B). In case of mono-hydroxyflavonols (4’HFnol and 7HFnol), UGT1A1 did not show any regiospecific preference of glucuronidation between 3-O and 4’-O (at 2.5 and 10μM) or 3-O and 7-O positions (at 10μM), but weak regiospecificity for 7-O position at 2.5μM (Fig. 4A-4B, Table 1). In dihydroxyflavones, UGT1A1 showed moderate regiospecificity at 10 μM while weak at 2.5 μM for 7-O position in 7,4’DHF. It showed dominant regiospecificity for 7-O position in 5,7DHF and for 4’-O position in 5,4’DHF at both 2.5 and 10μM substrate concentrations (Fig. 4A-4B, Table 1).
Figure 4. Regiospecific glucuronidation of flavonoids by UGT1A1 at 2.5 μM (A) and 10 μM (B).
Flavonoids (flavones and flavonols at 2.5 or 10 μM concentration) were incubated at 37 °C for 1 (or 0.5) hr with UGT1A1 (using optimum final protein concentration ~ 0.25, 0.5 or 1 mg/ml). The amounts of mono-glucuronide(s) formed were measured using UPLC. The amounts of each regiospecific mono-glucuronide formed were measured using UPLC. Rates of mono-glucuronide formation were calculated as nmol/hr/mg of protein. Each bar is the average of three determinations, and the error bars are the standard deviations of the mean (n=3). The regiospecific data of the flavonoids at 10 μM has been re-plotted from Figures 2 and 3. UGT stands for Uridine diphosphate glucuronosyltransferases).
UGT1A3
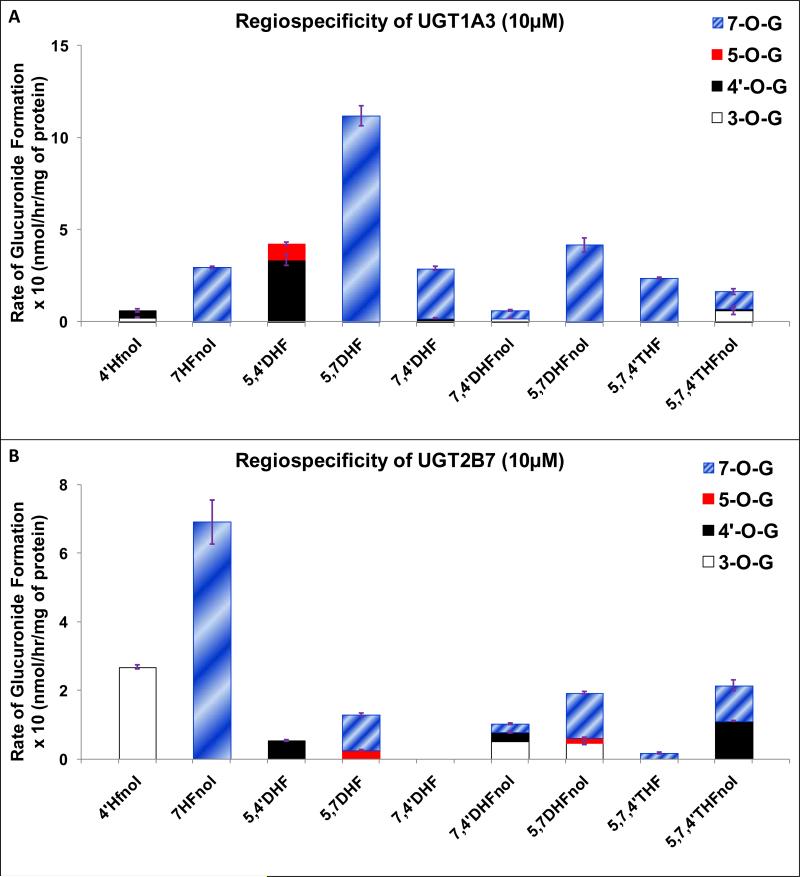
At 10 μM, UGT1A3 dominantly preferred glucuronidation of 7-O position in flavonols and flavones, wherever free hydroxyl group was present at C-7, except for 5,7,4’THFnol where UGT1A3 did not show dominant regiospecificity for 7-O position (Fig. 5A, Table 1). When 7-OH was absent, dominant regiospecificity was absent (Fig. 5A, Table 1).
Figure 5. Regiospecific glucuronidation of flavonoids by UGT1A3 (A) and UGT2B7 (B).
Flavonoids (flavones and flavonols at 10 μM concentration) were incubated at 37 °C for 1 (or 0.5) hr with UGT1A3/UGT2B7 (using optimum final protein concentration ~ 0.25, 0.5 or 1 mg/ml). The amounts of mono-glucuronide(s) formed were measured using UPLC. The amounts of each regiospecific mono-glucuronide formed were measured using UPLC. Rates of mono-glucuronide formation were calculated as nmol/hr/mg of protein. Each bar is the average of three determinations, and the error bars are the standard deviations of the mean (n=3). The regiospecific data of the flavonoids has been re-plotted from Figures 2 and 3. UGT stands for Uridine diphosphate glucuronosyltransferases).
UGT2B7
At 10 μM, UGT2B7 did not show strong preference at any particular position in flavonols (Fig. 5B, Table 1). However, number and position of hydroxyl group in the structure of flavonols affected which one (3-O or 7-O) or both (3-O and 7-O) are preferred position (Fig. 5B, Table 1). For flavones, moderate or dominant regiospecificity occurred at 7- hydroxyl group in 5,7DHF and 5,7,4’THF respectively (Fig. 5B, Table 1).
UGT1A6
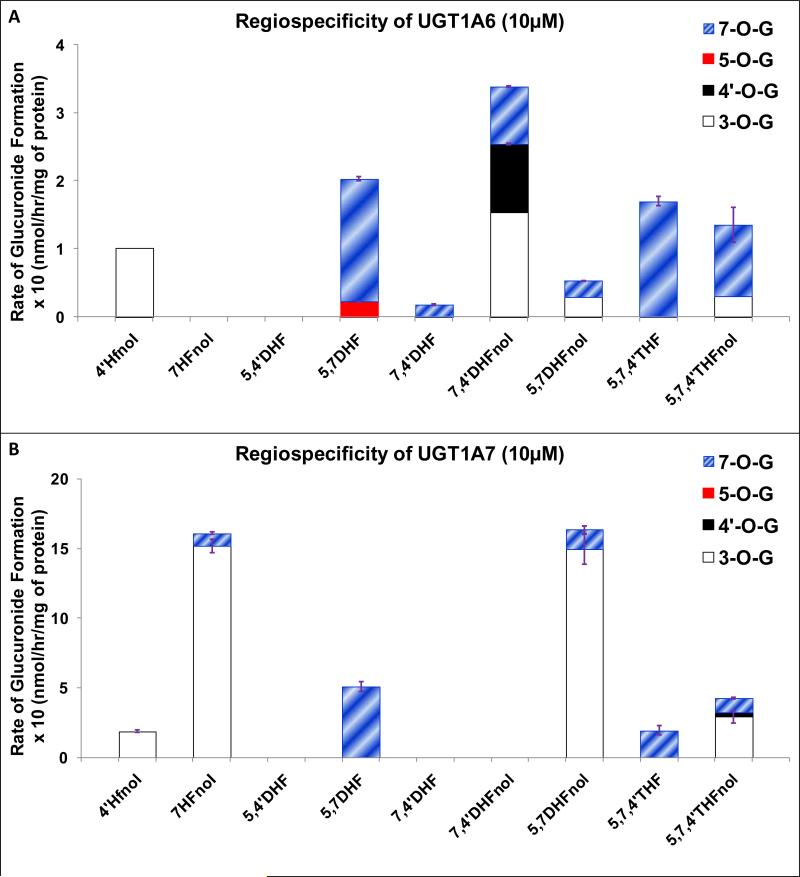
At 10 μM, for flavonols, UGT1A6 did not show any pattern for glucuronidating any particular position. In 4’HFnol, UGT1A6 showed dominant regiospecificity for 3-O position, whereas in 7HFnol and 7,4’DHFnol, no position was glucuronidated (Fig. 6A, Table 1). However, UGT1A6 showed dominant or moderate regiospecificity for 7-O position in flavones (Fig. 6A, Table 1). Position of glucuronidation appeared to be highly affected by the number and position of hydroxyl group in the structure of flavonoids.
Figure 6. Regiospecific glucuronidation of flavonoids by UGT1A6 (A) and UGT1A7 (B).
Flavonoids (flavones and flavonols at 10 μM concentration) were incubated at 37 °C for 1 (or 0.5) hr with UGT1A6/UGT1A7 (using optimum final protein concentration ~ 0.25, 0.5 or 1 mg/ml). The amounts of mono-glucuronide(s) formed were measured using UPLC. The amounts of each regiospecific mono-glucuronide formed were measured using UPLC. Rates of mono-glucuronide formation were calculated as nmol/hr/mg of protein. Each bar is the average of three determinations, and the error bars are the standard deviations of the mean (n=3). The regiospecific data of the flavonoids has been re-plotted from Figures 2 and 3. UGT stands for Uridine diphosphate glucuronosyltransferases).
UGT1A7
At 10 μM, UGT1A7 dominantly preferred glucuronidation of 3-O position over 7-O position in all flavonols (Fig. 6B, Table 1), except for 5,7,4’THFnol where 3-O position was only weakly preferred. However in flavones, 7-O position was dominantly favored (Fig. 6B, Table 1). UGT1A7 did not glucuronidate 4’-O and 5-O positions at all (Fig. 6B).
UGT1A8
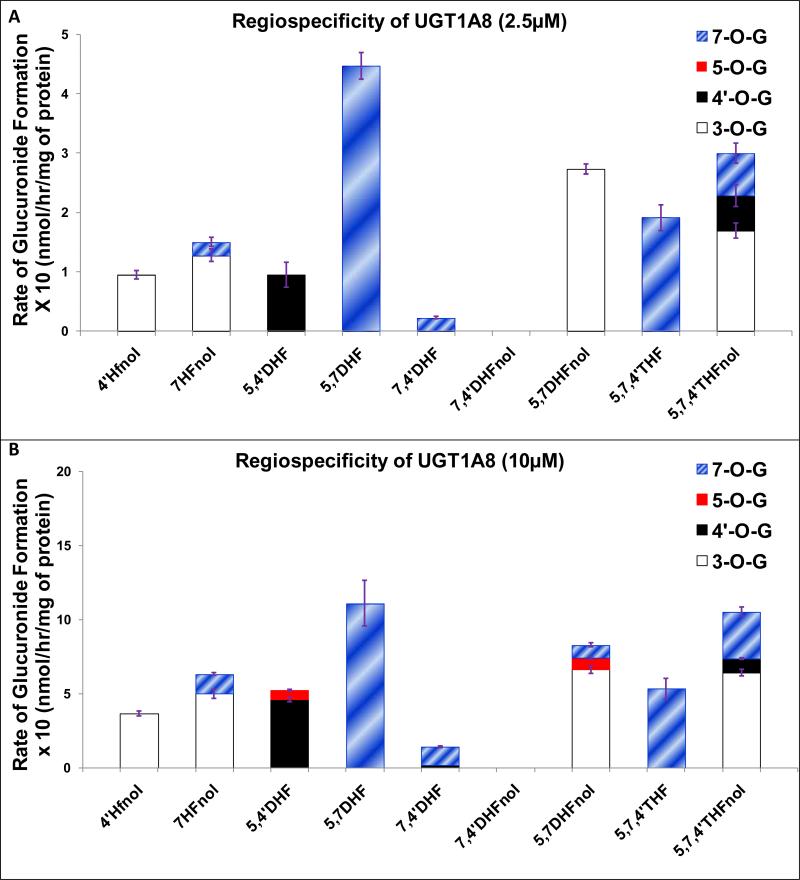
The glucuronidation of 4’-O and 5-O was not much favored by UGT1A8 at 10 μM and not at all favored at 2.5 μM (Fig. 7A-7B). At both 2.5 μM and 10 μM, UGT1A8 showed dominant or moderate regiospecificity for glucuronidating 3-O position in flavonols except in 5,7,4’THFnol where it showed only weak regiospecificity and 7,4’DHFnol which was not glucuronidated (Fig. 7A-7B, Table 1). UGT1A8 showed dominant or moderate regiospecificity for glucuronidating 7-O position in flavones at both concentrations (Fig. 7A-7B, Table 1).
Figure 7. Regiospecific glucuronidation of flavonoids by UGT1A8 at 2.5 μM (A) and 10 μM (B).
Flavonoids (flavones and flavonols at 2.5 or 10 μM concentration) were incubated at 37 °C for 1 (or 0.5) hr with UGT1A8 (using optimum final protein concentration ~ 0.25, 0.5 or 1 mg/ml). The amounts of mono-glucuronide(s) formed were measured using UPLC. The amounts of each regiospecific mono-glucuronide formed were measured using UPLC. Rates of mono-glucuronide formation were calculated as nmol/hr/mg of protein. Each bar is the average of three determinations, and the error bars are the standard deviations of the mean (n=3). The regiospecific data of the flavonoids at 10 μM has been re-plotted from Figures 2 and 3. UGT stands for Uridine diphosphate glucuronosyltransferases).
UGT1A9
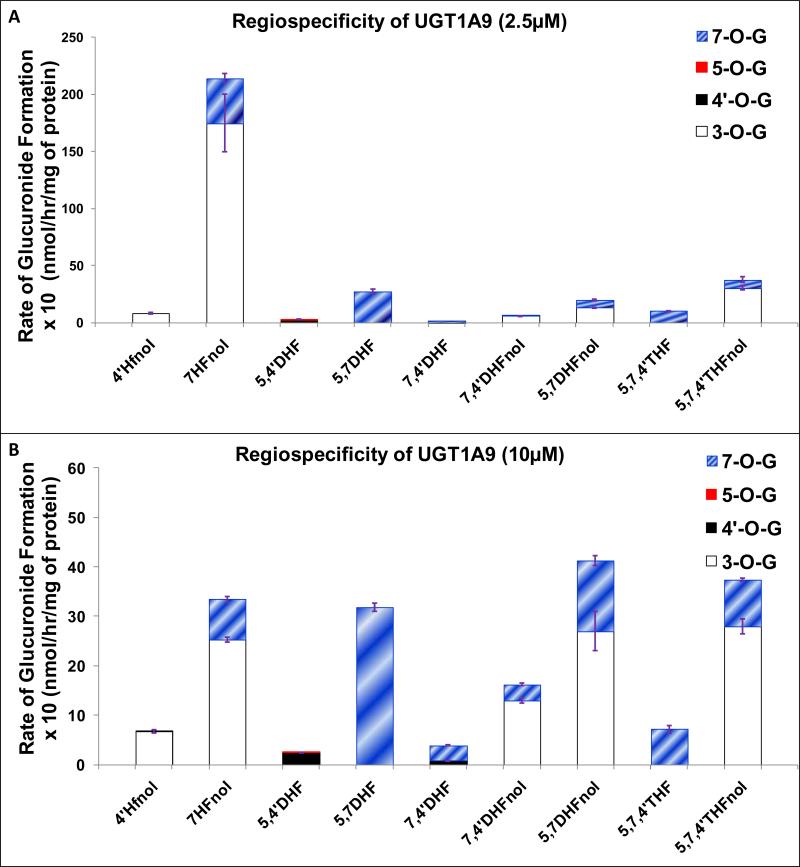
UGT1A9 mainly glucuronidated 3-O and 7-O positions in flavonols at both 2.5 μM and 10 μM, where 3-O was more favored position than 7-O for glucuronidation, except for 5,7THFnol at 10 μM, where 3-O and 7-O were glucuronidated at comparable rates (Fig. 8A-8B, Table 1). 7-O was dominantly preferred position of glucuronidation in flavones at both concentrations (Fig. 8A-8B, Table 1). Glucuronidation at 4’-O or 5-O position was not favored at all by UGT1A9 at both concentrations (Fig. 8A-8B).
Figure 8. Regiospecific glucuronidation of flavonoids by UGT1A9 at 2.5 μM (A) and 10 μM (B).
Flavonoids (flavones and flavonols at 2.5 or 10 μM concentration) were incubated at 37 °C for 1 (or 0.5) hr with UGT1A9 (using optimum final protein concentration ~ 0.25, 0.5 or 1 mg/ml). The amounts of mono-glucuronide(s) formed were measured using UPLC. The amounts of each regiospecific mono-glucuronide formed were measured using UPLC. Rates of mono-glucuronide formation were calculated as nmol/hr/mg of protein. Each bar is the average of three determinations, and the error bars are the standard deviations of the mean (n=3). The regiospecific data of the flavonoids at 10 μM has been re-plotted from Figures 2 and 3. UGT stands for Uridine diphosphate glucuronosyltransferases).
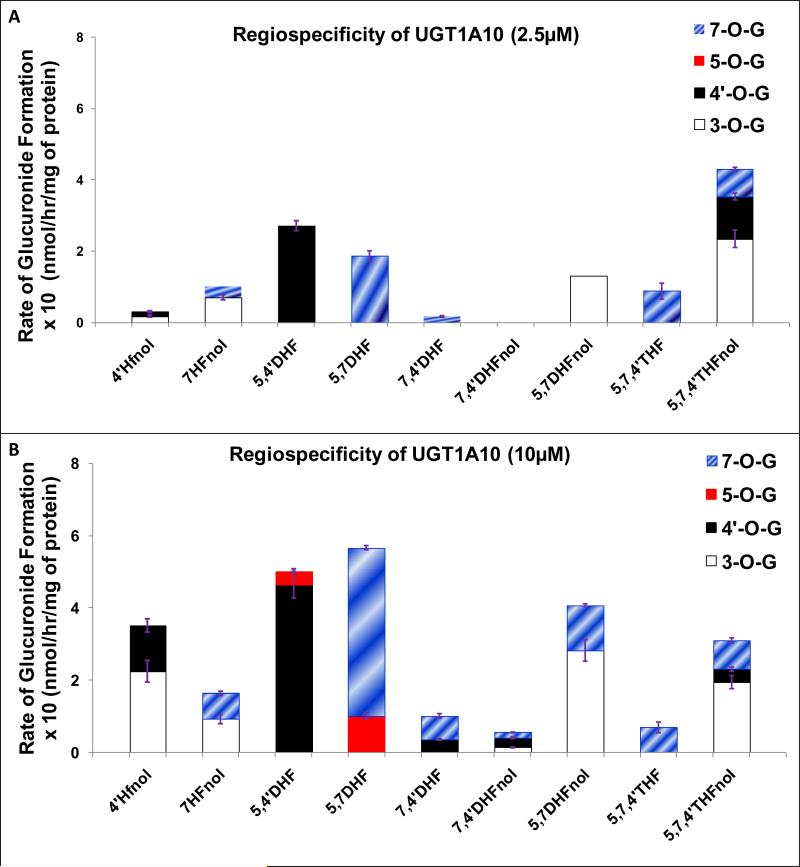
UGT1A10
UGT1A10 was the only isoform which rapidly glucuronidated all the positions (3-O, 4’-O, 5-O and 7-O) in selected flavonoids. However, UGT1A10 did not show any preference for glucuronidating any particular position (Fig. 9A-9B). Also, the degree of regiospecificity and position of preference of glucuronidation varied a lot for both flavonols and flavones at both 2.5 μM and 10 μM (Fig. 9A-9B, Table 1).
Figure 9. Regiospecific glucuronidation of flavonoids by UGT1A10 at 2.5 μM (A) and 10 μM (B).
Flavonoids (flavones and flavonols at 2.5 or 10 μM concentration) were incubated at 37 °C for 1 (or 0.5) hr with UGT1A10 (using optimum final protein concentration ~ 0.25, 0.5 or 1 mg/ml). The amounts of mono-glucuronide(s) formed were measured using UPLC. The amounts of each regiospecific mono-glucuronide formed were measured using UPLC. Rates of mono-glucuronide formation were calculated as nmol/hr/mg of protein. Each bar is the average of three determinations, and the error bars are the standard deviations of the mean (n=3). The regiospecific data of the flavonoids at 10 μM has been re-plotted from Figures 2 and 3. UGT stands for Uridine diphosphate glucuronosyltransferases).
Effect of higher substrate concentration on the regiospecificity of UGT 1A1, 1A8 and 1A9
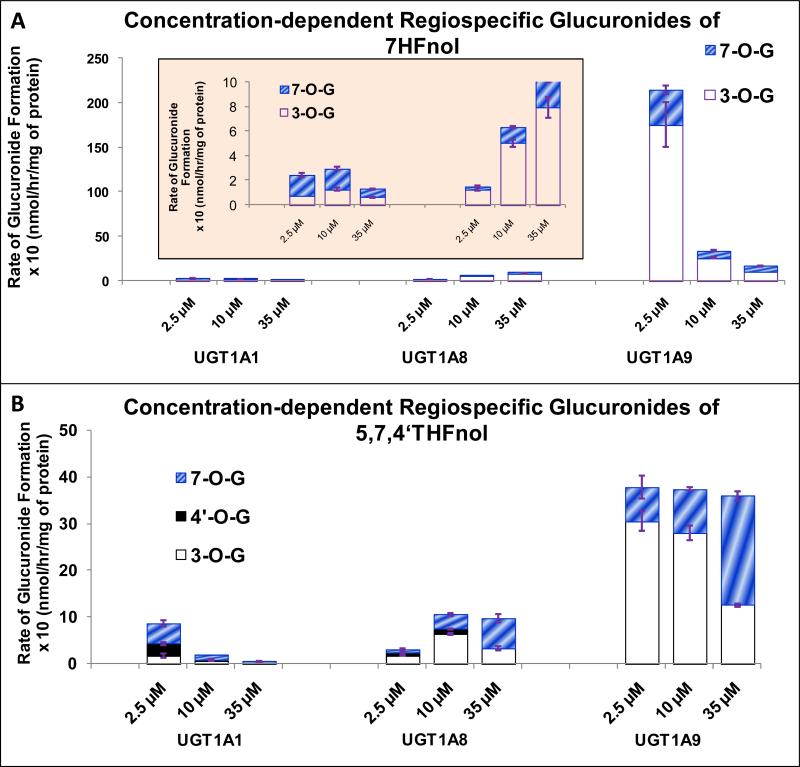
We also studied the effect of higher substrate concentration (35μM) on the regiospecificity of the three isoforms, UGT1A1, 1A8 and 1A9. Figure 10 represented the data of two flavanols (7HFnol and 5,7,4’THFnol) as examples. We found that the ratio of rates of glucuronidation of 3-O and 7-O positions in 7HFnol and 5,7,4’QHFnol by UGT1A1, 1A8 and 1A9 significantly changed with the concentration (p<0.05) (Figures 10A-10B).
Figure 10. Concentration-dependent regiospecific glucuronidation of 7HFnol (A) and 5,7,4’THFnol (B) by UGT 1A1, 1A8 and 1A9.
7HFnol and 5,7,4’THFnol (at 2.5, 10 and 35 μM concentration) were incubated at 37 °C for 1 (or 0.5) hr with UGT1A1, 1A8 or 1A9 (using optimum final protein concentration ~ 0.25, 0.5 or 1 mg/ml). The amounts of mono-glucuronide(s) formed were measured using UPLC. The amounts of each regiospecific mono-glucuronide formed were measured using UPLC. Rates of mono-glucuronide formation were calculated as nmol/hr/mg of protein. Each bar is the average of three determinations, and the error bars are the standard deviations of the mean (n=3). UGT stands for Uridine diphosphate glucuronosyltransferases).
For 7HFnol, UGT1A1 weakly preferred the glucuronidation of 7-O position at 2.5 μM, but showed no regiospecificity at 10 and 35μM substrate concentration (Fig. 10A). UGT1A8 showed moderate regiospecificity for 3-O position at all the three concentrations (Fig. 10A). UGT1A9 showed moderate regiospecificity for 3-O position at 2.5 and 10 μM, whereas no regiospecificity at 35μM substrate concentrations (Fig. 10A).
For 5,7,4’THFnol, UGT1A1 weakly preferred the glucuronidation of 7-O position at 2.5 μM, but showed no regiospecificity at 10 and 35μM substrate concentrations (Fig. 10B). UGT1A8 only showed weak regiospecificity at all the three concentrations; however 3-O was the preferred position of glucuronidation at 2.5 and 10 μM, while 7-O was the preferred position at 35μM substrate concentrations (Fig. 10B). UGT1A9 showed moderate regiospecificity for glucuronidation of 3-O position at 2.5μM, while weak regiospecificity for glucuronidation of 3-O position at 10μM substrate concentrations, but no regiospecificity at 35μM substrate concentration (Fig. 10B).
In conclusion, UGT1A1 showed similar regiospecificity at 10 and 35 μM for both compounds while behaved differently at 2.5 μM substrate concentration. UGT1A9 showed similar regiospecificity at 2.5 and 10 μM for both compounds while behaved differently at 35 μM substrate concentration. UGT1A8 also showed similar behavior for 5,7,4’THFnol as UGT1A9 but regiospecificity was independent of concentration for 7HFnol.
DISCUSSION
We concluded that regiospecific glucuronidation of flavonols was isoform- and concentration-dependent, whereas flavones were dominantly glucuronidated at 7-O position by most UGT isoforms (Figures 2-10). This is the first time that a study has demonstrated a UGT isoform-specific regiospecificity in glucuronidation of flavonoids, although the pattern of regiospecificity may be concentration-dependent. We showed that different UGT isoforms had differences in their regiospecificity of glucuronidation of flavonoids, however most isoforms preferred glucuronidation of 3-O position in flavonols followed by 7-O position and 7-O position in flavones, and 5-O position was hardly glucuronidated (Figures 2-10). Our findings on regiospecificity are consistent with conclusions of several published reports that investigated the glucuronidation of a particular or a few flavonoids. (21-23)
We also concluded that UGT1A3 and 1A7 showed dominant regiospecificity for only 7-O and 3-O position, respectively (Fig. 5A and 6B) (Table 1). UGT1A8 and 1A9 showed moderate or weak preference on glucuronidating position 3-O over 7-O position (Fig. 7 and 8) (Table 1), whereas other UGT isoforms, UGT1A1, 1A6, 1A10 and 2B7 showed either no positional preference or regiospecific pattern in most case (Fig. 4, 5B, 6A and 9) (Table 1). The regiospecificity patterns for UGT 1A3 and 1A6 were also confirmed at 2.5μM substrate concentration (data not shown).
The dominant and moderate regiospecificity of glucuronidation shown by different UGT isoforms can be useful in predicting the major glucuronide(s) formed in human plasma. For example, chrysin (5,7DHF) is shown to predominantly form 7-O-glucuronide in human volunteers (24). Chen et al. (2005) showed that the catalytic efficiency order for regiospecific glucuronidation of quercetin (3,5,7,3’-4’-pentahydroxyflavone or 5,7,3’-4’-tetrahydroxyflavonol) by UGT1A9 was 3- > 7- > 3′- > 4′-O-glucuronide.(21) The fact that 3-O-glucuronide of quercetin was also the main glucuronide found in bioavailability studies done in humans (8, 25, 26) showed that in vitro regiospecificity studies done using recombinant human UGT isoforms could give a reasonable prediction of the main glucuronide(s) to be found in vivo.
Day et al. (2000) showed that hydroxyl group on C-5 position did not glucuronidate (22) which confirmed our findings. This along with the fact that there has been no published reports of detecting in vivo 5-O-glucuronides of flavonoids supported our prediction that 5-O was not a favored site for glucuronidation of flavonoids. Even the weak regiospecificity can give useful prediction, if most of the UGT isoforms favors the glucuronidation of only a particular position. For example, after oral intake of kaempferol (5,7,4’THFnol) in human, 3-O-glucuronide of kaempferol was found to be the predominant form in plasma (27), which matched with our prediction based on the regiospecific glucuronidation of 5,7,4’THFnol in our study.
We also showed that the pattern and degree of regiospecificity of glucuronidation of flavonols was significantly affected by the substrate concentrations (Figures 4 and 7-9). For flavones, the preferred site of glucuronidation was independent of concentration used; however the degree of regiospecificity could change in certain cases (Figures 4 and 7-9). The differences in the in vivo cellular substrate concentration and the UGT isoforms expression in various organs (14) could significantly affect the various regiospecific glucuronide(s) formed in an organ. Yang et al (2010) showed that the Cmax of 7-O-glucuronide was four times higher than that of 4’-O-glucuronide during intravenous administration of genistein where liver was the first-pass metabolic organ. On the other hand, the Cmax of 7-O-G was only 1.85 times higher than that of 4’-O-glucuronide during per-oral administration of genistein where intestine was the first-pass metabolic organ.(28) This could have therapeutic implications in case of localized treatment, as the total concentration of a particular flavonoid available in an organ will be dependent on the rates of glucuronidation of the flavonoid and the rate of hydrolysis of various regiospecific glucuronide(s) back into the flavonoid in that organ (9, 10). For example, O'Leary et al. (2001) showed that the activity of β-glucuronidase found in human liver extract in hydrolyzing quercetin glucuronides was twice than the activity of β-glucuronidase found in human intestinal extract.(29) Also, the ratio of kcat/km of the human recombinant β-glucuronidase against hydrolysis of 3-O-glucuronide of quercetin was the highest, followed by 7-O-G and 4’-O-G.(29)
In conclusion, regiospecificity of glucuronidation of flavonols was an isoform- and concentration- dependent phenomenon, while most UGT isoforms showed dominant to moderate regiospecificity for 7-O position in glucuronidating flavones. For flavonols, certain hepatic and extra-hepatic UGT isoforms showed dominant regiospecificity for one position such as UGT1A3 for 7-O and UGT1A7 for 3-O position, whereas isoforms such as UGT1A8 and UGT1A9 mostly preferred glucuronidation at 3-O position followed by 7-O position. Rest of the UGT isoforms did not prefer glucuronidating any particular phenolic group. We believe that these insights about isoform-specific regiospecificity will be a great help in isoform-specific future in silico modeling of structure-metabolism relationship of glucuronidation of flavonoids/substrates by UGT enzymes. In a recent publication, Wu et al. (2011) successfully developed pharmacophore-based CoMFA model for prediction of UGT1A9-mediated formation of 3-O-Glucuronide of flavonols using recombinant human UGT1A9 isoform.(30) Further studies are required to delineate the protein structural differences among the UGT isoforms which are responsible for the dominant or preferred regiospecificity for a particular OH group in the flavonoids.
Supplementary Material
ACKNOWLEDGEMENT
This work was supported by NIH Grant No. GM070737 and a training fellowship from the Pharmacoinformatics Training Program of the Keck Center of the Gulf Coast Consortia (NIH Grant No. 5 R90 DK071505,03).
ABBREVIATIONS USED
- UGT
Uridine diphosphate glucuronosyltransferases
- UDP
Uridine diphosphate
- UDPGA
uridine diphosphoglucuronic acid
- UPLC
ultraperformance liquid chromatography
- MS
mass spectroscopy
- UV
ultraviolet
- HF
Hydroxyflavone
- DHF
dihydroxyflavone
- THF
trihydroxyflavone
- Fnol
flavonol
- HFnol
hydroxyflavonol
- DHFnol
dihydroxyflavonol
- THFnol
trihydroxyflavonol
- O
glucuronide
Footnotes
SUPPORTING INFORMATION AVAILABLE
UPLC chromatograms and UV spectras of 3-hydroxyflavone or flavonol (Fnol), 3,4’-dihydroxyflavone or 4’-hydroxyflavonol (4’-HFnol), 3,7-dihydroxyflavone or 7-hydroxyflavonol (7-HFnol), 5,4’-dihydroxyflavone (5,4’DHF), 5,7-dihydroxyflavone (5,7DHF), 7,4’-dihydroxyflavone (7,4’DHF), 3,7,4’-trihydroxyflavone or resokaempferol or 7,4’-dihydroxyflavonol (7,4’DHFnol) and 3,5,7-trihydroxyflavone or galangin or 5,7-dihydroxyflavonol (5,7DHFnol), 5,7,4’-trihydroxyflavone or apigenin (Api or 5,7,4’THF), 3,5,7,4’-tetrahydroxyflavone or kaempferol or 5,7,4’-trihydroxyflavonol (5,7,4’THFnol or Kamp) and their glucuronides.
REFRENCES
- 1.Nagar S, Remmel RP. Uridine diphosphoglucuronosyltransferase pharmacogenetics and cancer. Oncogene. 2006;25(11):1659–72. doi: 10.1038/sj.onc.1209375. [DOI] [PubMed] [Google Scholar]
- 2.Nowell SA, Massengill JS, Williams S, Radominska-Pandya A, Tephly TR, Cheng Z, Strassburg CP, Tukey RH, MacLeod SL, Lang NP, Kadlubar FF. Glucuronidation of 2-hydroxyamino-1-methyl-6-phenylimidazo[4, 5-b]pyridine by human microsomal UDP-glucuronosyltransferases: identification of specific UGT1A family isoforms involved. Carcinogenesis. 1999;20(6):1107–14. doi: 10.1093/carcin/20.6.1107. [DOI] [PubMed] [Google Scholar]
- 3.Tukey RH, Strassburg CP. Human UDP-glucuronosyltransferases: metabolism, expression, and disease. Annu Rev Pharmacol Toxicol. 2000;40:581–616. doi: 10.1146/annurev.pharmtox.40.1.581. [DOI] [PubMed] [Google Scholar]
- 4.Kiang TK, Ensom MH, Chang TK. UDP-glucuronosyltransferases and clinical drug-drug interactions. Pharmacol Ther. 2005;106(1):97–132. doi: 10.1016/j.pharmthera.2004.10.013. [DOI] [PubMed] [Google Scholar]
- 5.Lewis BC, Mackenzie PI, Elliot DJ, Burchell B, Bhasker CR, Miners JO. Amino terminal domains of human UDP-glucuronosyltransferases (UGT) 2B7 and 2B15 associated with substrate selectivity and autoactivation. Biochem Pharmacol. 2007;73(9):1463–73. doi: 10.1016/j.bcp.2006.12.021. [DOI] [PubMed] [Google Scholar]
- 6.Sorich MJ, Miners JO, McKinnon RA, Smith PA. Multiple pharmacophores for the investigation of human UDP-glucuronosyltransferase isoform substrate selectivity. Mol Pharmacol. 2004;65(2):301–8. doi: 10.1124/mol.65.2.301. [DOI] [PubMed] [Google Scholar]
- 7.Ishizawa K, Izawa-Ishizawa Y, Ohnishi S, Motobayashi Y, Kawazoe K, Hamano S, Tsuchiya K, Tomita S, Minakuchi K, Tamaki T. Quercetin glucuronide inhibits cell migration and proliferation by platelet-derived growth factor in vascular smooth muscle cells. J Pharmacol Sci. 2009;109(2):257–64. doi: 10.1254/jphs.08236fp. [DOI] [PubMed] [Google Scholar]
- 8.Janisch KM, Williamson G, Needs P, Plumb GW. Properties of quercetin conjugates: modulation of LDL oxidation and binding to human serum albumin. Free Radic Res. 2004;38(8):877–84. doi: 10.1080/10715760410001728415. [DOI] [PubMed] [Google Scholar]
- 9.Basu NK, Ciotti M, Hwang MS, Kole L, Mitra PS, Cho JW, Owens IS. Differential and special properties of the major human UGT1-encoded gastrointestinal UDP-glucuronosyltransferases enhance potential to control chemical uptake. J Biol Chem. 2004;279(2):1429–41. doi: 10.1074/jbc.M306439200. [DOI] [PubMed] [Google Scholar]
- 10.Lambert JD, Sang S, Yang CS. Biotransformation of green tea polyphenols and the biological activities of those metabolites. Mol Pharm. 2007;4(6):819–25. doi: 10.1021/mp700075m. [DOI] [PubMed] [Google Scholar]
- 11.Tang L, Singh R, Liu Z, Hu M. Structure and concentration changes affect characterization of UGT isoform-specific metabolism of isoflavones. Mol Pharm. 2009;6(5):1466–82. doi: 10.1021/mp8002557. [DOI] [PMC free article] [PubMed] [Google Scholar]
- 12.Tang L, Ye L, Singh R, Wu B, Zhao J, Lv C, Liu Z, Hu M. Use of Glucuronidation Fingerprinting to Describe and Predict mono- and di- Hydroxyflavone Metabolism by Recombinant UGT Isoforms and Human Intestinal and Liver Microsomes. Molecular Pharmaceutics. 2010 doi: 10.1021/mp900223c. DOI: 10.1021/mp900223c. [DOI] [PMC free article] [PubMed] [Google Scholar]
- 13.Xu H, Kulkarni KH, Singh R, Yang Z, Wang SW, Tam VH, Hu M. Disposition of naringenin via glucuronidation pathway is affected by compensating efflux transporters of hydrophilic glucuronides. Mol Pharm. 2009;6(6):1703–15. doi: 10.1021/mp900013d. [DOI] [PMC free article] [PubMed] [Google Scholar]
- 14.Izukawa T, Nakajima M, Fujiwara R, Yamanaka H, Fukami T, Takamiya M, Aoki Y, Ikushiro S, Sakaki T, Yokoi T. Quantitative analysis of UDP-glucuronosyltransferase (UGT) 1A and UGT2B expression levels in human livers. Drug Metab Dispos. 2009;37(8):1759–68. doi: 10.1124/dmd.109.027227. [DOI] [PubMed] [Google Scholar]
- 15.Siissalo S, Zhang H, Stilgenbauer E, Kaukonen AM, Hirvonen J, Finel M. The Expression of Most UDP-Glucuronosyltransferases (UGTs) Is Increased Significantly during Caco-2 Cell Differentiation, whereas UGT1A6 Is Highly Expressed Also in Undifferentiated Cells. Drug Metabolism and Disposition. 2008;36(11):2331–2336. doi: 10.1124/dmd.108.022335. [DOI] [PubMed] [Google Scholar]
- 16.Mabry TJ, Markham KR, Thomas MB. The systematic identification of flavonoids. Springer-Verlag; New York: 1970. p. xi.p. 354. [Google Scholar]
- 17.Markham KR. Techniques of flavonoid identification. Academic Press; London: New York: 1982. p. xi.p. 113. [Google Scholar]
- 18.Singh R, Wu B, Tang L, Liu Z, Hu M. Identification of the Position of Mono-O-Glucuronide of Flavones and Flavonols by Analyzing Shift in Online UV Spectrum (lambda max) Generated from an Online Diode-arrayed Detector. J Agric Food Chem. 2010;58(17):9384–95. doi: 10.1021/jf904561e. [DOI] [PMC free article] [PubMed] [Google Scholar]
- 19.Joseph TB, Wang SW, Liu X, Kulkarni KH, Wang J, Xu H, Hu M. Disposition of flavonoids via enteric recycling: enzyme stability affects characterization of prunetin glucuronidation across species, organs, and UGT isoforms. Mol Pharm. 2007;4(6):883–94. doi: 10.1021/mp700135a. [DOI] [PMC free article] [PubMed] [Google Scholar]
- 20.Liu X, Tam VH, Hu M. Disposition of flavonoids via enteric recycling: determination of the UDP-glucuronosyltransferase isoforms responsible for the metabolism of flavonoids in intact Caco-2 TC7 cells using siRNA. Mol Pharm. 2007;4(6):873–82. doi: 10.1021/mp0601190. [DOI] [PMC free article] [PubMed] [Google Scholar]
- 21.Chen YK, Chen SQ, Li X, Zeng S. Quantitative regioselectivity of glucuronidation of quercetin by recombinant UDP-glucuronosyltransferases 1A9 and 1A3 using enzymatic kinetic parameters. Xenobiotica. 2005;35(10-11):943–54. doi: 10.1080/00498250500372172. [DOI] [PubMed] [Google Scholar]
- 22.Day AJ, Bao Y, Morgan MR, Williamson G. Conjugation position of quercetin glucuronides and effect on biological activity. Free Radic Biol Med. 2000;29(12):1234–43. doi: 10.1016/s0891-5849(00)00416-0. [DOI] [PubMed] [Google Scholar]
- 23.Otake Y, Hsieh F, Walle T. Glucuronidation versus oxidation of the flavonoid galangin by human liver microsomes and hepatocytes. Drug Metab Dispos. 2002;30(5):576–81. doi: 10.1124/dmd.30.5.576. [DOI] [PubMed] [Google Scholar]
- 24.Walle T, Otake Y, Brubaker JA, Walle UK, Halushka PV. Disposition and metabolism of the flavonoid chrysin in normal volunteers. Br J Clin Pharmacol. 2001;51(2):143–6. doi: 10.1111/j.1365-2125.2001.01317.x. [DOI] [PMC free article] [PubMed] [Google Scholar]
- 25.Day AJ, Mellon F, Barron D, Sarrazin G, Morgan MR, Williamson G. Human metabolism of dietary flavonoids: identification of plasma metabolites of quercetin. Free Radic Res. 2001;35(6):941–52. doi: 10.1080/10715760100301441. [DOI] [PubMed] [Google Scholar]
- 26.Wittig J, Herderich M, Graefe EU, Veit M. Identification of quercetin glucuronides in human plasma by high-performance liquid chromatography-tandem mass spectrometry. J Chromatogr B Biomed Sci Appl. 2001;753(2):237–43. doi: 10.1016/s0378-4347(00)00549-1. [DOI] [PubMed] [Google Scholar]
- 27.DuPont MS, Day AJ, Bennett RN, Mellon FA, Kroon PA. Absorption of kaempferol from endive, a source of kaempferol-3-glucuronide, in humans. Eur J Clin Nutr. 2004;58(6):947–54. doi: 10.1038/sj.ejcn.1601916. [DOI] [PubMed] [Google Scholar]
- 28.Yang Z, Zhu W, Gao S, Xu H, Wu B, Kulkarni K, Singh R, Tang L, Hu M. Simultaneous determination of genistein and its four phase II metabolites in blood by a sensitive and robust UPLC-MS/MS method: Application to an oral bioavailability study of genistein in mice. J Pharm Biomed Anal. 53(1):81–9. doi: 10.1016/j.jpba.2010.03.011. [DOI] [PMC free article] [PubMed] [Google Scholar]
- 29.O'Leary KA, Day AJ, Needs PW, Sly WS, O'Brien NM, Williamson G. Flavonoid glucuronides are substrates for human liver beta-glucuronidase. FEBS Lett. 2001;503(1):103–6. doi: 10.1016/s0014-5793(01)02684-9. [DOI] [PubMed] [Google Scholar]
- 30.Wu B, Morrow JK, Singh R, Zhang S, Hu M. Three-dimensional quantitative structure-activity relationship studies on UGT1A9-mediated 3-O-glucuronidation of natural flavonols using a pharmacophore,based comparative molecular field analysis model. J Pharmacol Exp Ther. 2011;336(2):403–13. doi: 10.1124/jpet.110.175356. [DOI] [PMC free article] [PubMed] [Google Scholar]
Associated Data
This section collects any data citations, data availability statements, or supplementary materials included in this article.


