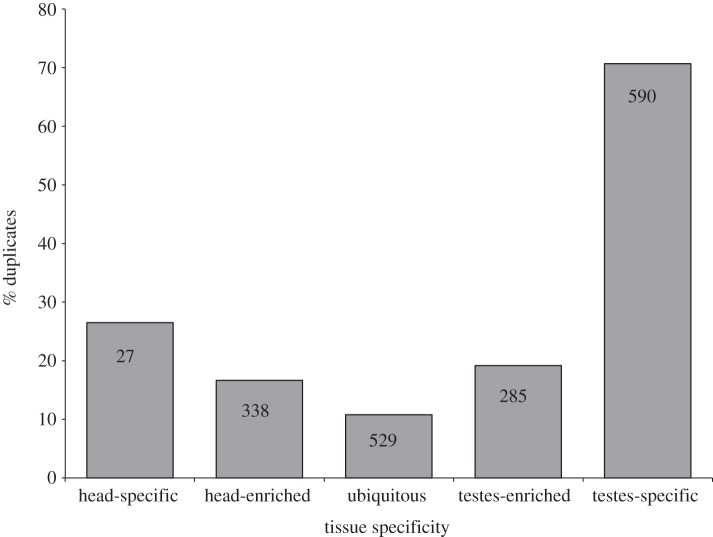
Figure 2.
The relationship between gene duplication and tissue specificity of gene expression in T. dalmanni. Columns indicate the percentage of genes for a given tissue expression pattern that are composed of genes that have undergone a gene duplication. The numbers within the columns provide the total number of duplicate paralogues that fall within that expression category. Tissue-‘enriched’ genes are defined as genes that are expressed five times more than in the other tissue and tissue-‘specific’ genes are expressed 500 times more than in the other tissue.

