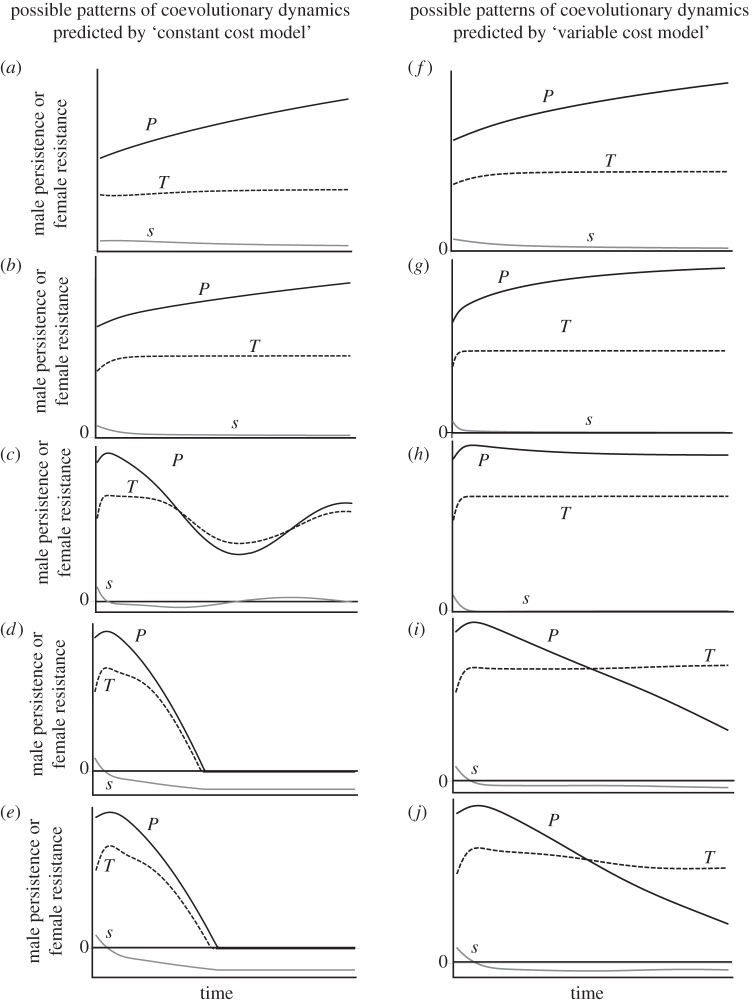
Figure 2.
‘The variable cost model’ gives qualitatively different predictions about the coevolutionary dynamics of male persistence and female resistance, when both female threshold and sensitivity evolve. Similar to figure 1, (a–e) and (f–j) denote increasing cost of mating for females, under ‘constant cost’ and ‘variable cost’ models, respectively. The parameter value different from the analyses given in figure 1 is: vT = 0.5. For the rest of the parameters, refer to figure 1 caption.

