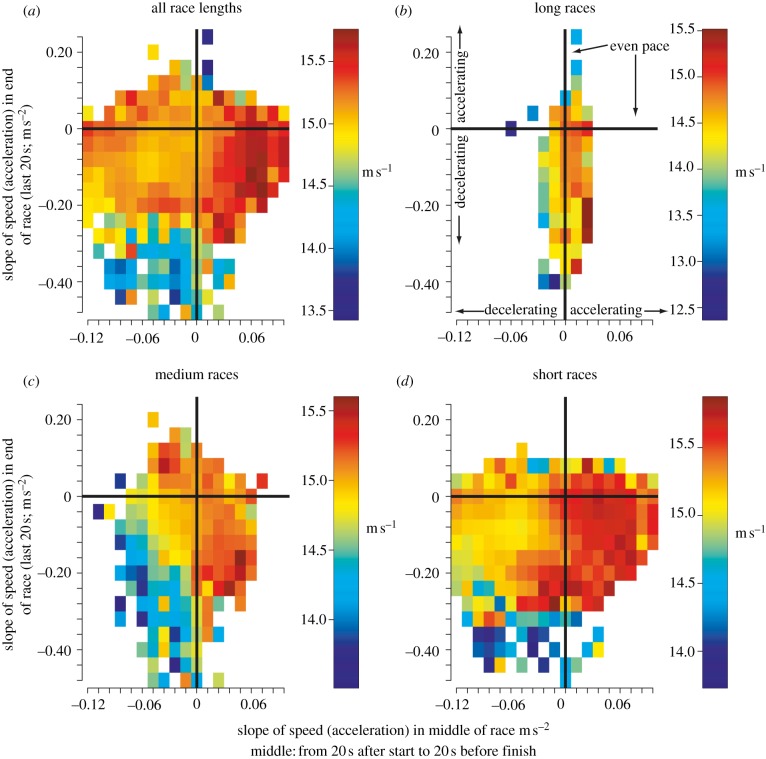
Figure 2.
The average speed over the entire race was computed for each individual horse start in the dataset. This figure displays the median of these average speeds (colour) in bins determined by the slope of speed in the middle of the race (x-axis, positive = acceleration; from 20 s after start until 20 s before the end of the race; m s−2) and slope of speed at the end of the race (y-axis; last 20 s of the race; m s−2). Similar plots are shown for (a) all race distances, (b) for long races only, (c) medium races only and (d) short races only (distances as defined in figure 1). Generally, the fastest speeds are correlated with even or increasing speed during the middle of the race (x-axis greater than zero), and decreasing speed at the end of the race (y-axis less than zero). An alternate strategy of even or increasing speed at the end of race (‘chaser’ horses; y-axis greater than zero) can also produce high average speeds; with speeds closest to the decreasing speed strategy seen in medium distance races (c, middle slope approx. −0.04, end slope approx. 0.07 m s−2).

