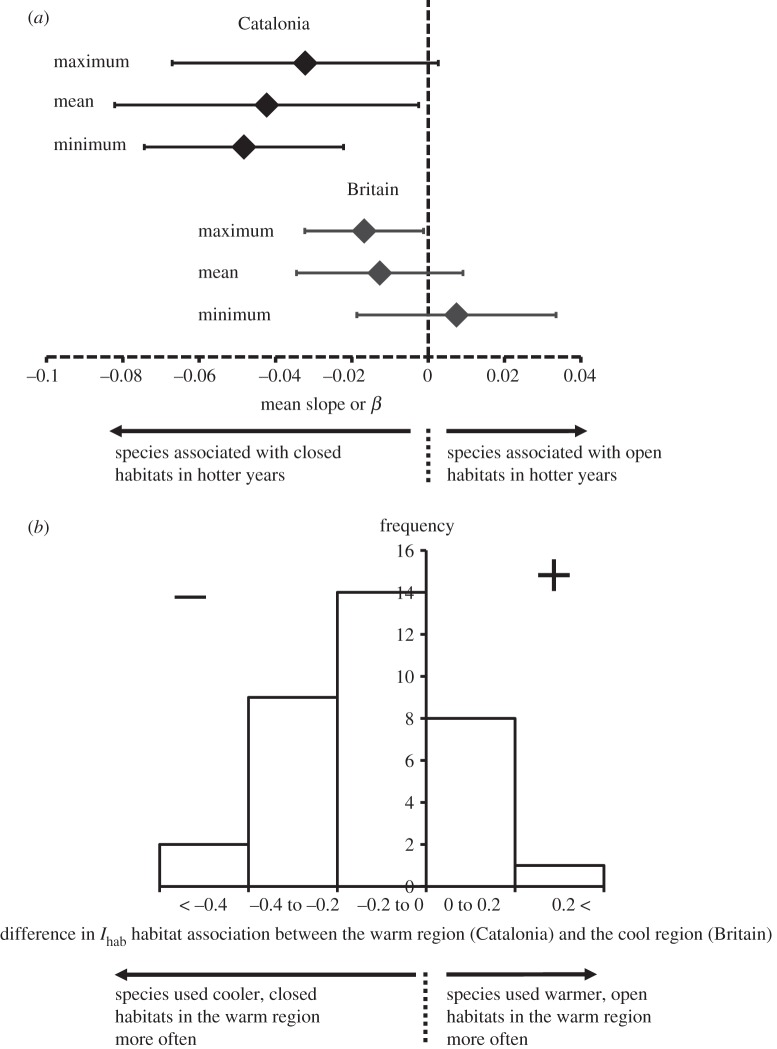
Figure 1.
Changes in butterfly habitat association with (a) year-to-year and (b) geographical variation in climate. (a) Generalized-linear model slopes of annualized habitat associations against annual climate for maximum, mean and minimum temperatures. Error bars denote 95% CIs of the means across species. (b) Difference in the open or closed habitat association of butterflies in Britain and Catalonia. Positive values denote more frequent association with warmer, open habitats (e.g. grassland) in the warmer region, whereas negative values denote species more associated with cooler, closed habitats (e.g. woodland) in the warmer region.

