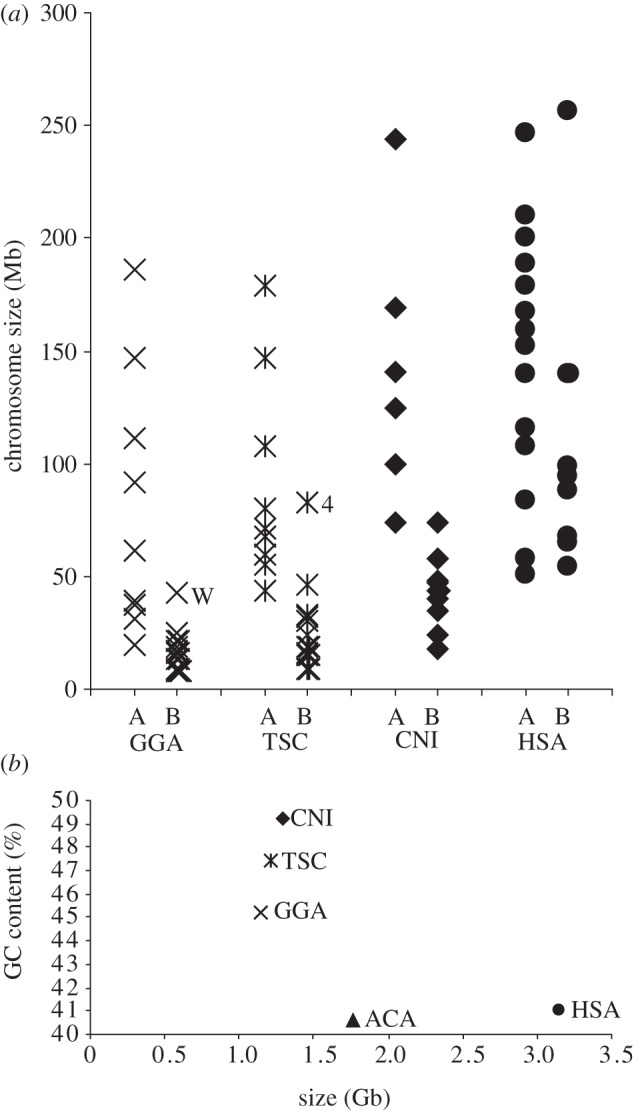
Figure 2.

(a) GGA, CNI and TSC chromosomes classified into two groups based on GC content show strong relation to size. The CNI small chromosomes are larger than GGA and TSC microchromosomes, but have a higher GC content than the CNI large chromosomes. (b) The correlation between TG size and GC content is shown for the three species and compared with HSA.
