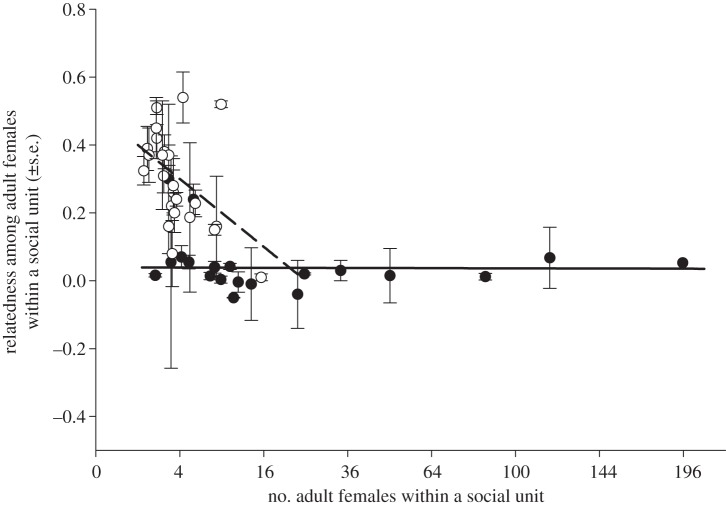
Figure 1.
Mean relatedness among adult females within a social unit (±s.e.) as a function of average number of females within a social unit. Species with allomaternal care (and significantly higher genetic relatedness values within social units) are shown as open symbols and broken regression lines. Species without allomaternal care (and lower relatedness within social unit) are shown as filled symbols and solid regression lines. Regression lines are the results of generalized least squares analysis. Values on the x-axis reflect that number of females within a social unit was square-root transformed prior to analysis.

