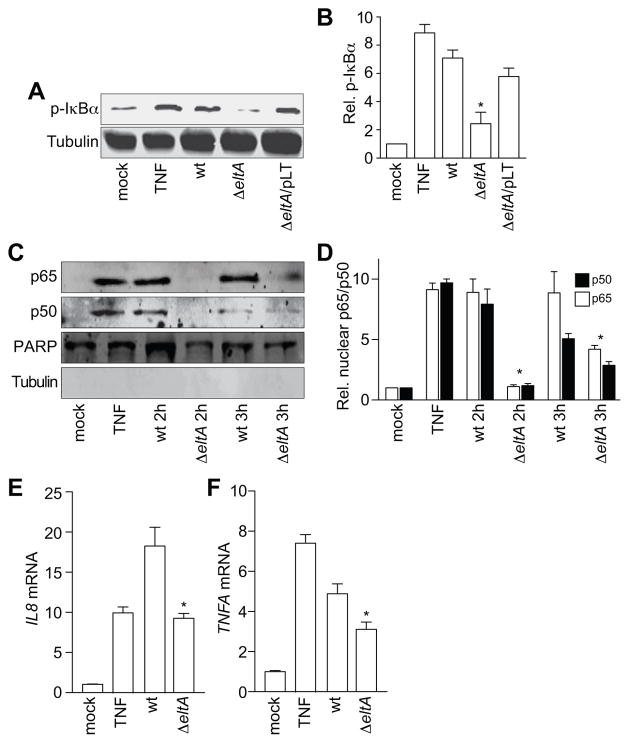
Figure 2. ETEC induces LT-dependent NF-κB activation.
A. Immunoblotting of phosphorylated IκBα after treating HCT-8 cells with TNF-α (20 ng/ml, 30′) or infecting them with either wt, ΔeltA, or ΔeltA/pLT ETEC for 2 h. B. Quantification of relative phosphorylated IκBα levels shown in panel A. Data are presented as mean ± SEM, n = 5, with asterisks (*) used to indicate a statistically significant difference from wt ETEC (p < 0.05, Student’s t test). C. Immunoblotting of nuclear-localized NF-κB p65 and p50 subunits after treating HCT-8 cells with TNF-α (20 ng/ml, 30′) or infecting them with either wt or ΔeltA ETEC for 2 or 3 h. PARP and tubulin immunoblotting were used to normalize nuclear protein concentrations and to demonstrate the absence of contaminating cytoplasmic proteins in the nuclear fractions, respectively. D. Quantification of nuclear p65 and p50 data shown in panel C. Data are presented as mean ± SEM, n = 3, with asterisks (*) used to indicate a statistically significant difference from wt ETEC (p < 0.05, Student’s t test). E–F. Quantification of the relative abundance of IL8 (E) and TNFA (F) transcripts after treating HCT-8 cells with TNF-α (20 ng/ml, 30′) or infecting them with ETEC (2 h). Data are presented as mean ± SEM, n = 3, with asterisks (*) used to indicate a statistically significant difference from wt ETEC (p < 0.05, Student’s t test).

