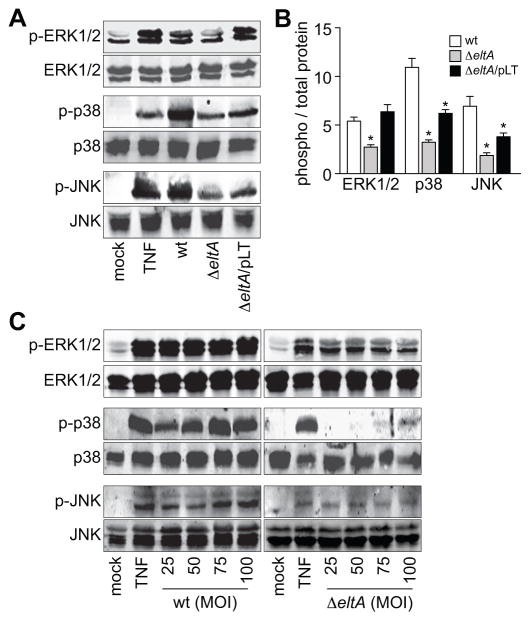
Figure 3. ETEC induces LT-dependent MAPK activation.
A. Immunoblotting of total and phosphorylated ERK1/2, p38, and JNK after treating HCT-8 cells with TNF-α (20 ng/ml, 30′) or infecting them with either wt, ΔeltA, or ΔeltA/pLT ETEC for 2 h. B. Quantification of relative phosphoprotein abundance from data shown in panel A. Data are presented as mean ± SEM, n = 3–4, with asterisks (*) used to indicate a statistically significant difference from wt ETEC (p < 0.05, Student’s t test). C. Immunoblotting of total and phosphorylated ERK1/2, p38, and JNK after treating HCT-8 cells with TNF-α (20 ng/ml, 30′) or infecting them with variable amounts of either wt or ΔeltA ETEC (MOIs ranging from 25–100).

