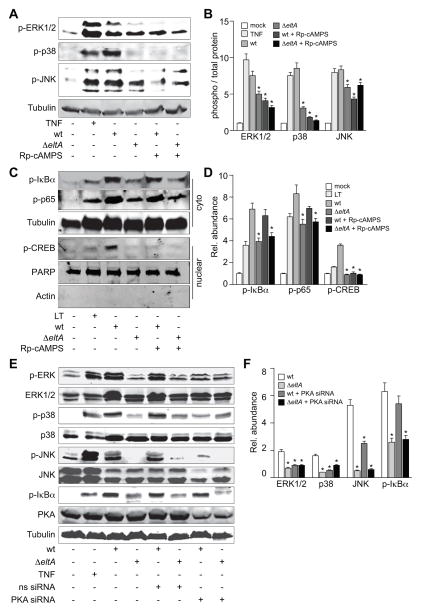
Figure 4. ETEC activation of MAPKs, but not NF-κB, is PKA-dependent.
A. Immunoblotting of phosphorylated ERK1/2, p38, and JNK after treating HCT-8 cells with TNF-α (20 ng/ml, 30′) or infecting them with either wt or ΔeltA ETEC for 2 h. Where indicated, HCT-8 cells were first treated with Rp-cAMPS (200 μM, 1 h). B. Quantification of relative phosphoprotein abundance from data shown in panel A. Data are presented as mean ± SEM, n = 3–5, with asterisks (*) used to indicate a statistically significant difference from wt ETEC (p < 0.05, Student’s t test). C. Immunoblotting of phosphorylated IκBα, phosphorylated p65, and phosphorylated nuclear CREB after treating HCT-8 cells with LT (1 μg/ml, 30′) or infecting them with either wt or ΔeltA ETEC for 2 h. Where indicated, HCT-8 cells were first treated with Rp-cAMPS (200 μM, 1 h). D. Quantification of data shown in panel C. Data are presented as mean ± SEM, n =3, with asterisks (*) used to indicate a statistically significant difference from wt ETEC (p < 0.05, Student’s t test). E. Immunoblotting of phosphorylated p38, ERK1/2, JNK, IκBα, and nuclear NF-κB p65 after treating HCT-8 cells with TNF-α (20 ng/ml, 30′) or infecting them with wt or ΔeltA ETEC for 2 h. Where indicated, HCT-8 cells were first transfected (48 h prior to infection) with an siRNA duplex targeting PKA. Phosphorylated protein abundance was normalized to total protein abundance and/or to tubulin. F. Quantification of data shown in panel E. Data are presented as mean ± SEM, n = 3, with asterisks (*) used to indicate a statistically significant difference from wt ETEC (p < 0.05, Student’s t test).

