
Figure 1.
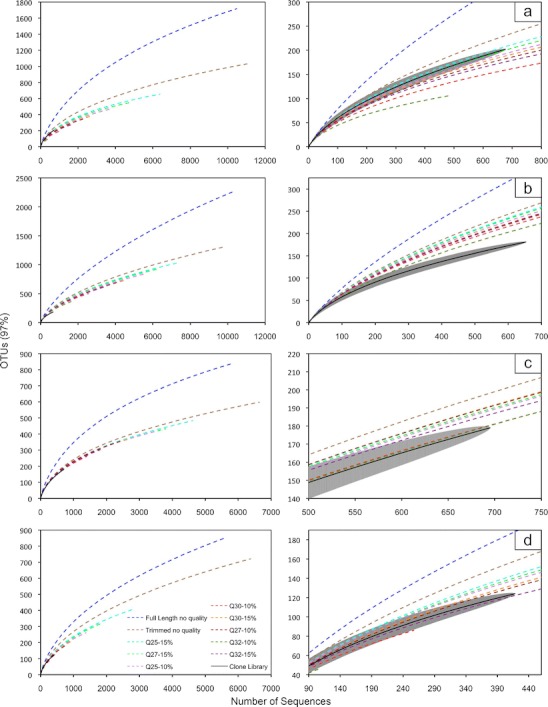
Species richness estimates for the V1V2 (a), V3 (b), V4 (c), and V6 (d) SSU rRNA gene regions. Full and enlarged rarefaction curves are displayed for each region of the SSU rRNA gene. Operational taxonomic units (OTUs) are clustered at 97 % similarity. The wide gray line in the enlarged rarefaction curves represents 95 % confidence intervals for the clone library species richness predictions