
Figure 2.
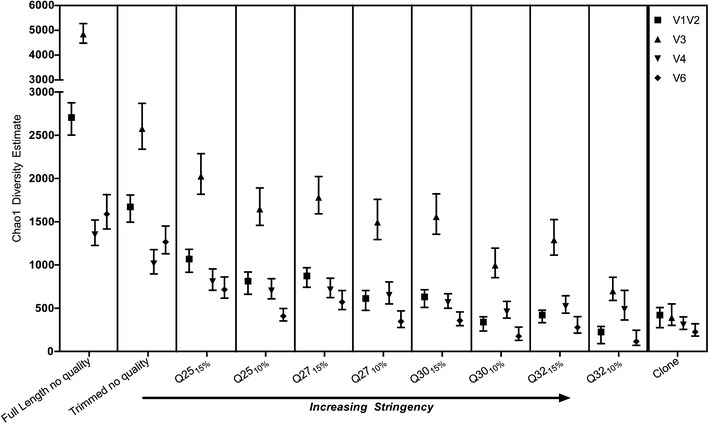
Chao1 diversity estimates for the same samples at different Q filtering compared to the respective clonal library. Error bars denote 95 % confidence intervals
Official websites use .gov
A
.gov website belongs to an official
government organization in the United States.
Secure .gov websites use HTTPS
A lock (
) or https:// means you've safely
connected to the .gov website. Share sensitive
information only on official, secure websites.
Chao1 diversity estimates for the same samples at different Q filtering compared to the respective clonal library. Error bars denote 95 % confidence intervals