
Figure 3.
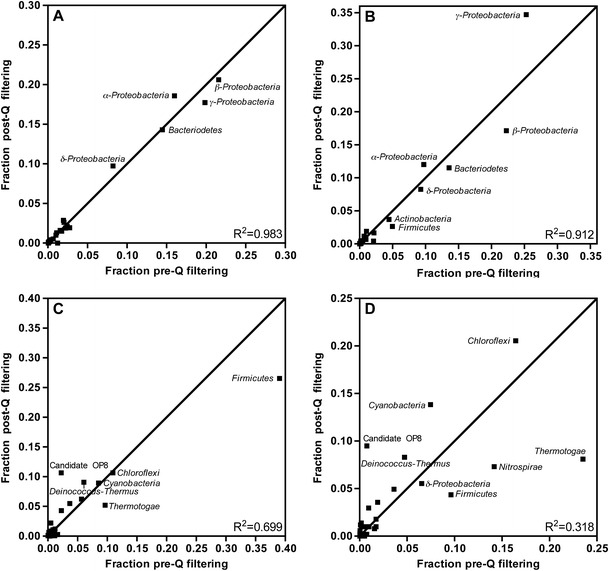
Phylogenetic comparison pre- and post-quality filtering. The phylum (class for Proteobacteria) distribution was compared for each region of the SSU rRNA gene at the Q suggested by the rarefaction curves in Fig. 1 (Q2715% for V1V2 (a), Q3210% for V3 (b), Q3010% for V4 (c), and Q3215% for V6 (d)). The coordinates for each taxon correspond to the abundance by fraction of unfiltered sequences (x-axis) and fraction of filtered high-quality sequences (y-axis). The scale differs across graphs to maximize point separation. Taxa along the line of y = x did not show a shift in percent abundance during filtering while those left and above the line represent phylogenetic groups that shifted to higher abundance post-filtering, and those right and below the line had a lower abundance post-filtering. Linear regression analysis to the line y = x yielded R 2 values that indicate how well each region fits the assumption that the sequences removed were not phylogenetically biased