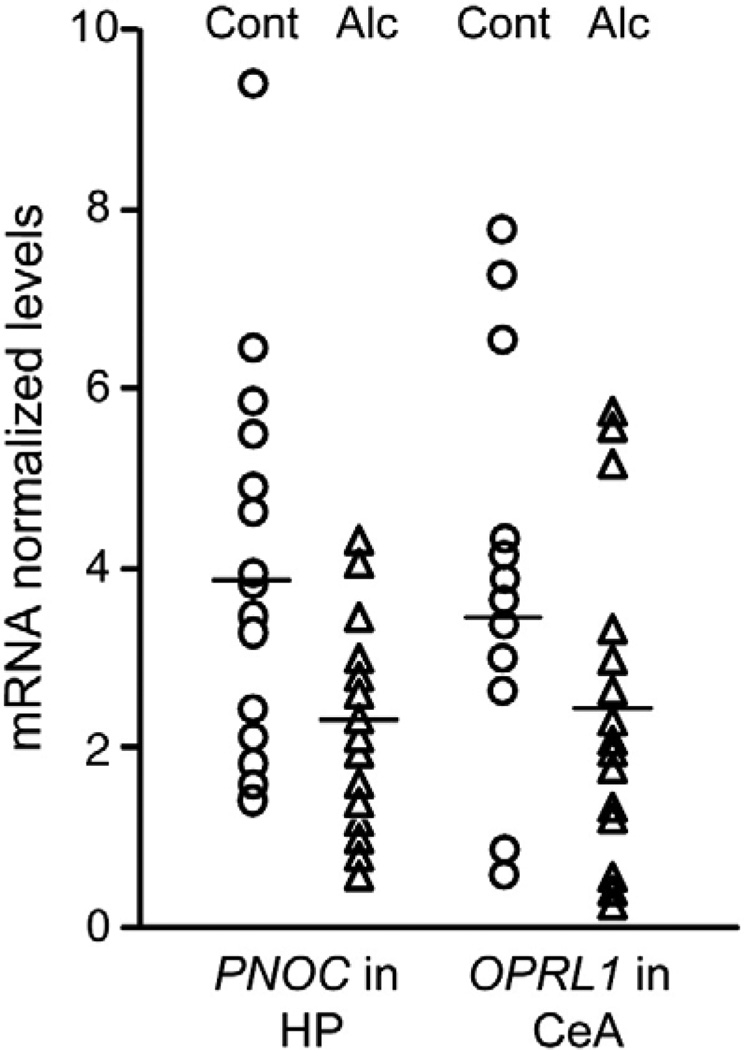
Fig. 1.
Levels of PNOC and OPRL1 mRNAs in the hippocampal dentate gyrus (HP) and central amygdala (CeA). mRNA levels are presented as normalized to reference genes. Open circles and triangles represent individual levels of mRNAs for control and alcoholic subjects, respectively. Mean levels for the groups are shown by horizontal lines.

