Figure 4.
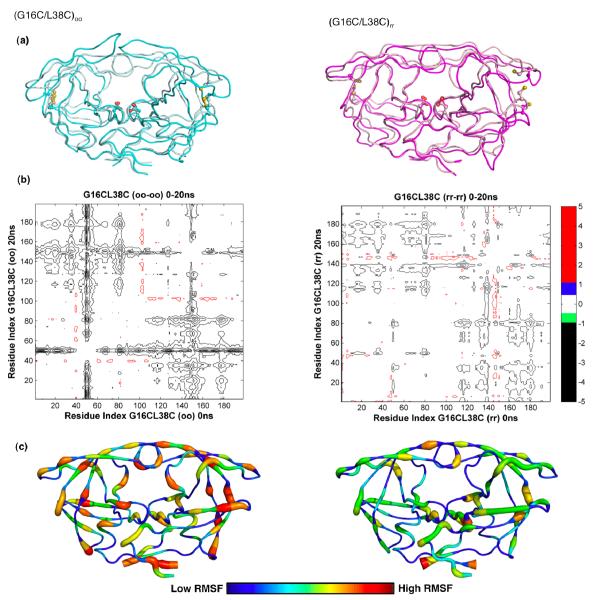
Molecular dynamics simulation analyses. (a) Backbone superposition of (G16C/L38C)oo from 0ns (cyan) and at 20ns (pale cyan) and (G16C/L38C)rr from 0ns (light pink) to 20ns (magenta) in MD simulations. The side chains of active site aspartic acids and the engineered cysteines are displayed. (b) Differences in internal Cα-Cα distances between the 0ns and 20ns snapshots of the cross-linked (oo) and non-crosslinked (rr) forms of (G16C/L38C) variant are shown in the double difference plots. Each contour line represents a deviation by 0.5Å. Black, green, blue and red distinguish the contour ranges −1.0 Å and below, −1.0 to −0.5 Å, 0.5-1.0 Å and 1 Å and above, respectively. (c) Average RMSF of protease residues in (G16C/L38C)oo and (G16C/L38C)rr proteases from 20ns MD simulation trajectories. Protease molecules from 5, 10, 15 and 20ns simulations were superposed on to the 0ns crystal structure using the most invariant residues, 24 to 26 and 85 to 95. The average Cα RMSFs were calculated and mapped on to a representative protease molecule with the most variable regions depicted in red and the most invariant regions depicted in blue.

