Abstract
Objective
To compare precision and evaluate equivalence of femorotibial cartilage volume (VC) and mean cartilage thickness (ThCtAB.Me) from independent segmentation teams using identical MR images from three series: sagittal 3D Dual Echo in the Steady State (DESS), coronal multi-planar reformat (DESS-MPR) of DESS and coronal 3D Fast Low Angle SHot (FLASH).
Design
19 subjects underwent test-retest MR imaging at 3 Tesla. Four teams segmented the cartilage using prospectively defined plate regions and rules. Mixed models analysis of the pooled data were used to evaluate the effect of acquisition, team and plate on precision and Pearson correlations and mixed models to evaluate equivalence.
Results
Segmentation team differences dominated measurement variability in most cartilage regions for all image series. Precision of VC and ThCtAB.Me differed significantly by team and cartilage plate, but not between FLASH and DESS. Mean values of VC and ThCtAB.Me differed by team (P<0.05) for DESS, FLASH and DESS-MPR, FLASH VC was 4–6% larger than DESS in the medial tibia and lateral central femur, and FLASH ThCtAB.Me was 5–6% larger in the medial tibia, but 4–8% smaller in the medial central femur. Correlations betweenDESS and FLASH for VC and ThCtAB.Me were high (r=0.90–0.97), except for DESS versus FLASH medial central femur ThCtAB.Me (r=0.81–0.83).
Conclusions
Cartilage morphology metrics from different image contrasts had similar precision, were generally equivalent, and may be combined for cross-sectional analyses if potential systematic offsets are accounted for. Data from different teams should not be pooled unless equivalence is demonstrated for cartilage metrics of interest.
Keywords: Magnetic Resonance, knee, cartilage, morphometry, quantitation, osteoarthritis
Introduction
Osteoarthritis (OA) is a leading cause of disability and loss of independence[1], although much of its pathophysiology is not well understood and no proven cures or treatments which prevent or delay onset have been found[2]. The Osteoarthritis Initiative[3] is a public-private partnership jointly sponsored by the National Institutes of Health (NIH) and pharmaceutical industry, targeted at identifying the most promising biomarkers for development and progression of symptomatic knee OA. The OAI enrolled 4,796 men and women ages 45–79, who either have, or are at increased risk of developing, knee OA. These subjects will be evaluated over at least 9 years with radiography and Magnetic Resonance (MR) imaging, biochemical, genetic and clinical assessments of disease activity. The images, clinical data, and biospecimens are public access resources[3].
The OAI knee MR protocol supports development of potential imaging biomarkers, particularly segmentation and quantification of cartilage morphologic changes[3–9] such as cartilage volume (VC) or mean thickness over the total area of bone (ThCtAB.Me). Segmentation[4–7, 10–13] requires both high spatial resolution and high image contrast and was the primary motivation to use 3D Dual Echo in the Steady State (DESS) acquisitions and 3 Tesla (T) MR systems[4, 14]. At the time the OAI began, DESS had not yet been validated for quantitative cartilage morphometry, hence both coronal 3D FLASH (Fast Low Angle SHot)[13] acquisition for central weight-bearing femoro-tibial cartilage morphometry and sagittal 3D DESS acquisition for cartilage morphometry over the entire knee were included[3, 4].
FLASH acquisitions at 1.5T and 3T have since been cross-validated[11, 15–17] and shown to have equivalent precision for quantitative cartilage measurements. The OAI also undertook a pilot study to validate quantitative cartilage morphometry using both coronal FLASH and sagittal DESS, to determine whether reproducible segmentation could be accomplished by different segmentation teams, and whether sagittal DESS and multi-planar reformat (DESSMPR) of sagittal DESS provide equivalent results to coronal FLASH. Four cartilage segmentation teams evaluated the same sets of de-identified, randomly ordered test-retest MR images, and individually published their results[18–24, 54]. However, the pooled results from these teams have not been directly compared.
The present analysis objectives were to determine the impact of segmentation team on cartilage morphology metrics and to use pooled data from all four teams to a) compare the overall reliability of cross-sectional cartilage measurements from DESS and FLASH, b) determine the equivalence of cartilage measurements from the two acquisitions, and c) determine the impact of image contrast, image plane, and cartilage region on precision and cartilage metric values. This work represents one component necessary to qualify cartilage biomarkers from DESS image contrast by comparison to the previously validated FLASH.
Methods
Study Participants
The 19 subjects enrolled in this pilot study met OAI eligibility criteria with an expanded lower age limit (40 years) [3]. Clinical knee OA was defined as having symptoms on the majority of days in one month over the past year and a physician diagnosis of knee OA. Knees classified as without clinical OA did not meet these requirements. One knee per subject was scanned twice on the same day after repositioning. Approximately equal numbers of knees with and without clinical OA were included.
Knee radiographs were not performed. However, 13 subjects were also enrolled in the OAI and had site-based Kellgren-Lawrence grades [25] from their screening knee radiographs. There was one grade 0 study knee, seven grade 1 knees, four grade 2 knees, and one grade 3knee. All grade 2 and 3 knees were in the clinical OA group; all grade 0 and 1 knees were in the non-clinical-OA group.
This study was performed at The Ohio State University and Memorial Hospital of Rhode Island under review and approval of the local institutional review boards. All subjects gave informed consent.
MR Acquisition
Images were acquired on 3T MR systems (Siemens Magnetom Trio, Erlangen, Germany) using quadrature transmit-receive knee coils (USA Instruments, Aurora, OH)[4, 18–23]. There were no activity, time of day, or dietary restrictions before the MR exams. After the first exam, the subject was allowed to walk for ~10 minutes before repeating the exam. All images were reviewed by the technologist and were immediately reacquired if any were unacceptable (orientation, incomplete anatomical coverage, motion, artifact, etc.).
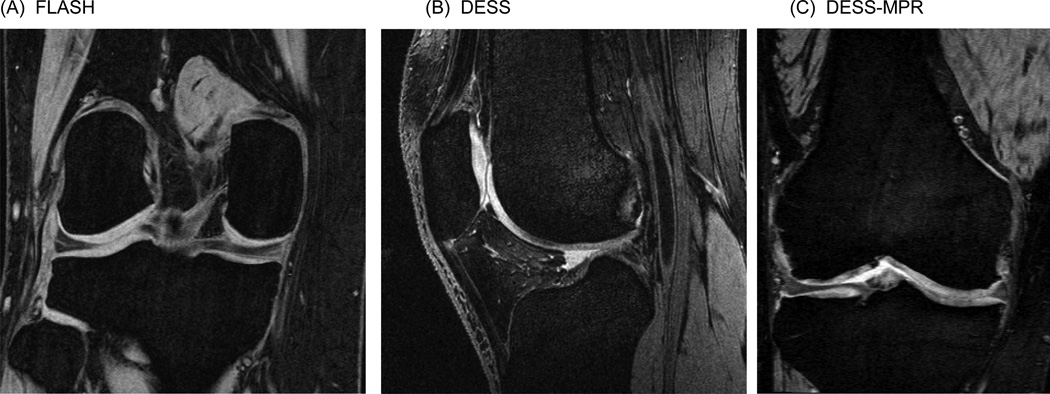
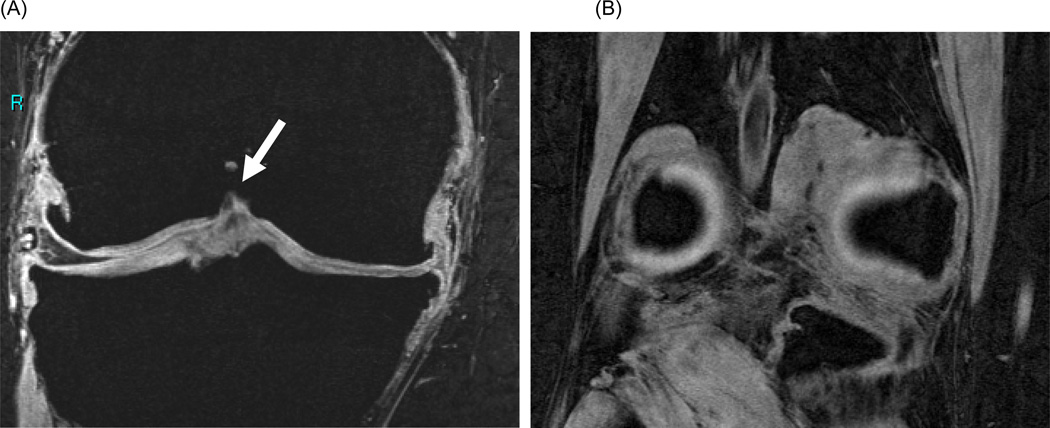
Two 3D acquisitions, identical to those used in the OAI, were included[4, 18–24]: 1) A 1.5 mm slice thickness double-oblique coronal 3D FLASH with water excitation (Figure 1A) acquired with the posterior edges of the medial and lateral femoral condyles located in the same coronal slice or not more than 2 slices apart (Figure 2)[26]. 2) A 0.7mm slice thickness sagittal 3D DESS with water excitation series acquired orthogonal to the coronal FLASH (Figure 1B). 1.5 mm double-oblique coronal images (DESS-MPR) oriented identical to FLASH were created from the sagittal DESS images (Figure 1C).
Figure 1.
Sample images from (A) FLASH, (B) DESS, and (C) DESS-MPR.
Figure 2.
Sample FLASH images depicting (A) the anterior boundary of coronal image segmentation which includes distinct condylar cartilage (green arrow) and (B) the double ‘bulls-eye’ landmark posterior boundary containing both cartilage and bone for calculation of 60% coverage rule.
Image Segmentation
The 114 series were de-identified, randomized, and the teams blinded to subject identification and order of acquisition. Images were segmented independently, i.e. were not paired for analysis, to achieve better insight into the impact of contrast and plane on equivalence and test-retest precision of independent measurements.
The femoro-tibial cartilage was divided into four plates by anatomic location: the medial tibia (MT), lateral tibia (LT), central (weight-bearing) medial femur (cMF), and central lateral femur (cLF)[26, 27]. The cartilage plate locations and segmentation rules were prospectively defined by consensus. All slices that displayed cartilage underwent segmentation, except those with substantial partial volume averaging at the margins. Cartilage covering peripheral osteophytes was excluded.
The cMF and cLF were differentiated from the trochlear and posterior femoral regions in the coronal plane with the anterior boundary defined as the first image where the continuous trochlear cartilage layer separated into distinct cartilage layers (Fig. 2B), the “bone bite”[26]. The posterior boundary was defined as 60% of the distance between the anterior boundary and the last image containing the posterior aspects of the femoral condyles, i.e., “double bulls-eye” containing both cartilage and bone (Figure 2B). These definitions were selected because they are less dependent on the knee flexion angle and included a greater number of slices than previous studies[26], thereby increasing the amount of cartilage measured with the goal of reducing measurement variability[28]. Cartilage regions of interest were defined similarly in both the sagittal and coronal planes by using the same landmarks and 3D viewing during segmentation.
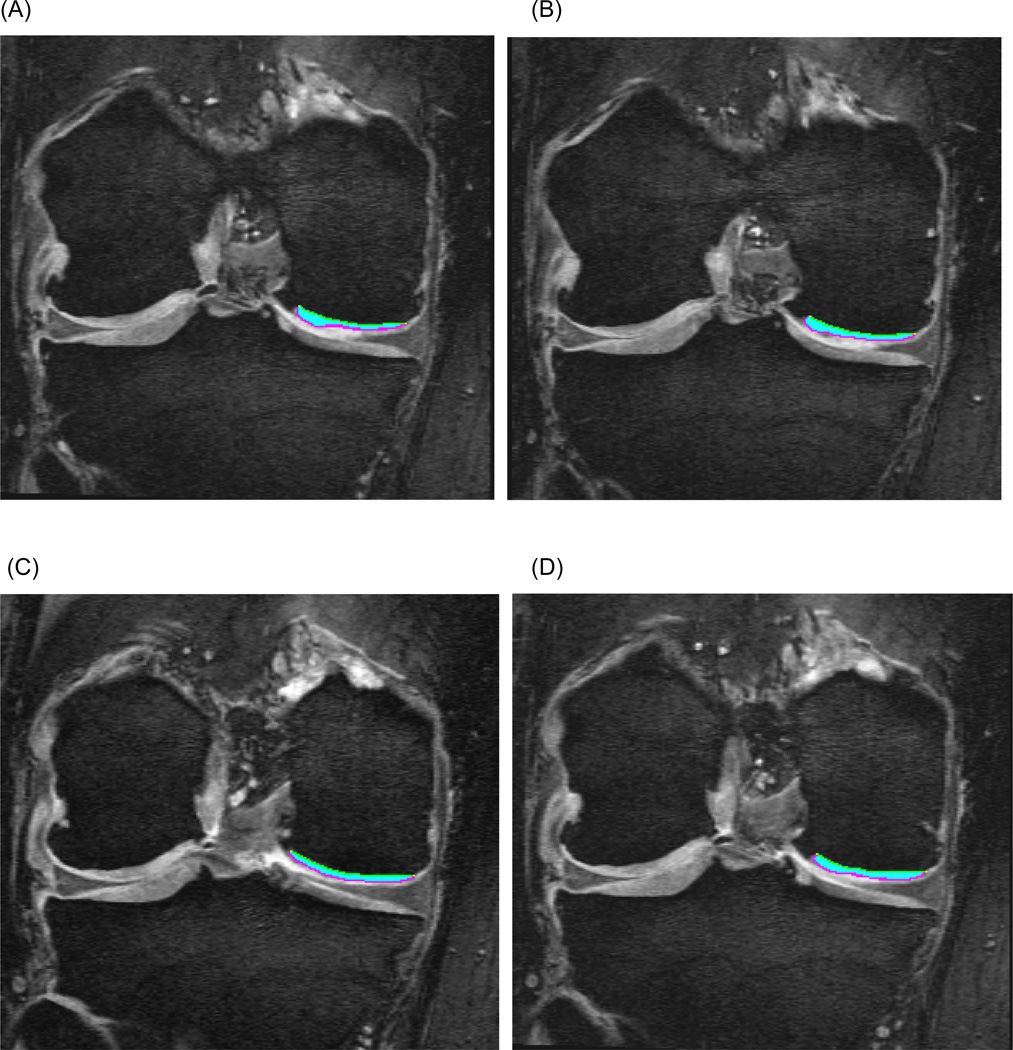
Imaging metrics (Figure 3) included cartilage volume (VC) and mean thickness over the total area of bone (ThCtAB.Me)[27]. The individual segmentation teams utilized their standard methods to calculate these values.
Figure 3.
Sample cartilage segmentation of the central medial femur (cMF) on four consecutive coronal DESS-MPR slices.
Statistical Analysis
Test-retest precision
Bland-Altman plots of test-retest differences for each cartilage biomarker were visually assessed for variance to mean relationships and out-of-bounds measures. The variance of each test-retest pair of measurements ((y1−y2)2/2) was calculated and the root mean square errors (RMSE) for pooled data were derived using the square root of the average variance of the pairs. The RMSE was divided by the overall group means of the pairs to determine the RMSE coefficient of variation (CV%). The RMSE is smaller (sqrt 2) than the standard deviation of the differences used in calculating Bland-Altman 95% limits of agreement. Measurements from all teams were combined for pooled estimates of precision. Using pooled data, mixed model analyses (SAS Proc MIXED) based on maximum likelihood estimation were performed to evaluate the effect (F-test in the mixed model analysis) of the independent variables of acquisition (contrast and plane), cartilage plate and segmentation team and their interactions on precision, with ln((y1−y2)2/2) as the dependent variable and including a random effect for knee to account for repeated measures within a knee.
The sensitivity of precision to outliers was assessed by: 1) deleting isolated test-retest pairs with differences greater than 4 standard deviations (SDs) above or below the mean; and 2) excluding teams that had significantly higher precision error compared to at least two other teams for a given plate.
Equivalence
The average cartilage biomarker value of the test-retest pair was used as a surrogate for the true value for a knee. The mean and SD of VC and ThCtAB.Me were calculated for each combination of acquisition, cartilage plate and team and for data from all teams combined. To evaluate systematic differences in cartilage biomarker values between teams and between FLASH and DESS contrast, mixed model analyses (SAS Proc MIXED) based on maximum likelihood estimation were performed to evaluate the effect (t-test in the mixed model analysis) of these independent variables on the average cartilage values as dependent variables and including a random effect for knee. Normality assumptions for the mixed model analyses of equivalence and test-retest precision were assessed graphically via Bland-Altman and conditional residuals plots (SAS Proc MIXED). No concerns were noted other than occasional outliers, which were addressed by removal. The pooled values were compared between acquisitions using two-way scatter plots, Bland-Altman plots, and Pearson correlation coefficients.
Results
Subjects
The 19 subjects (7 men, 12 women) had a mean±SD age 51.6±7.6years (range 40.2–71.3 years) and body mass index 30.4±6.1kg/m2 (range 19.1–44.0kg/m2). Ten study knees had clinical OA; ten knees were right knees (5 with OA) and nine left knees (5 with OA).
Image Segmentation Teams
Four teams submitted data, but one team submitted femoral results using two independent methods (designated Teams B and D); therefore five sets of femoral results are presented. Teams A, B and C used manual cartilage segmentation; Team D used an automated central femoral plate definition; Team E used a semi-automated approach followed by manual correction. Team A submitted only tibial VC results. Team E used different region definitions for the tibial cartilage plates segmented in the sagittal and coronal planes. Teams B and D excluded cartilage on the plate edges.
Test-Retest Differences
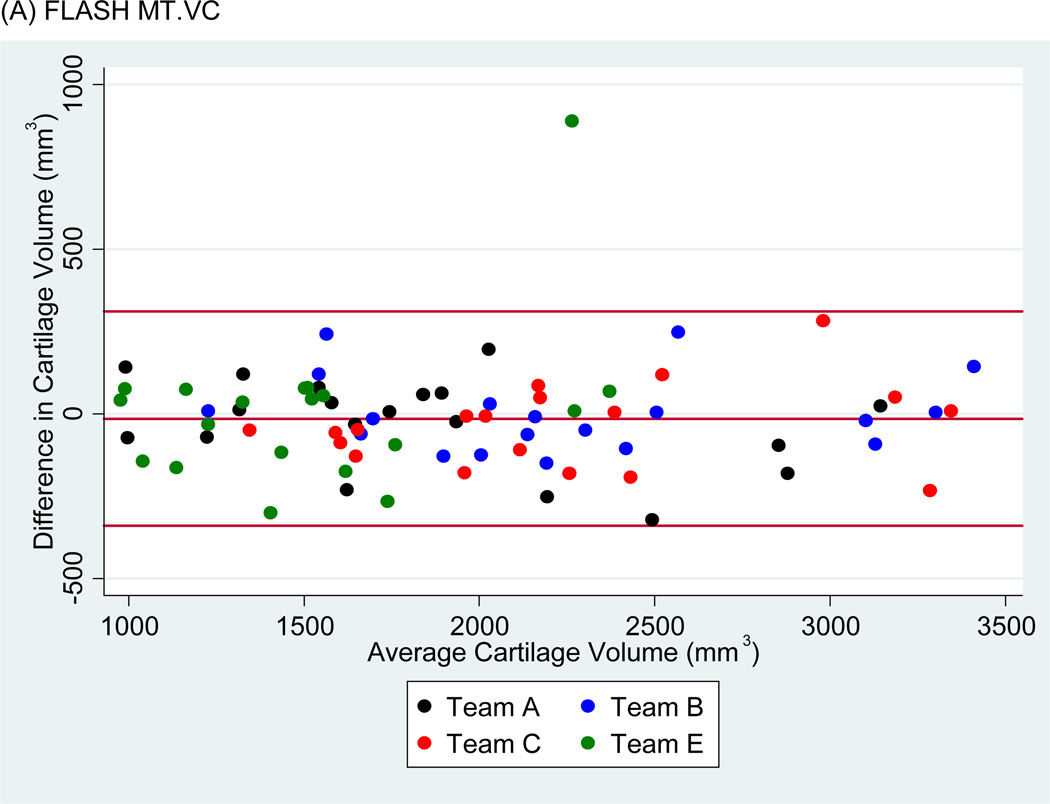
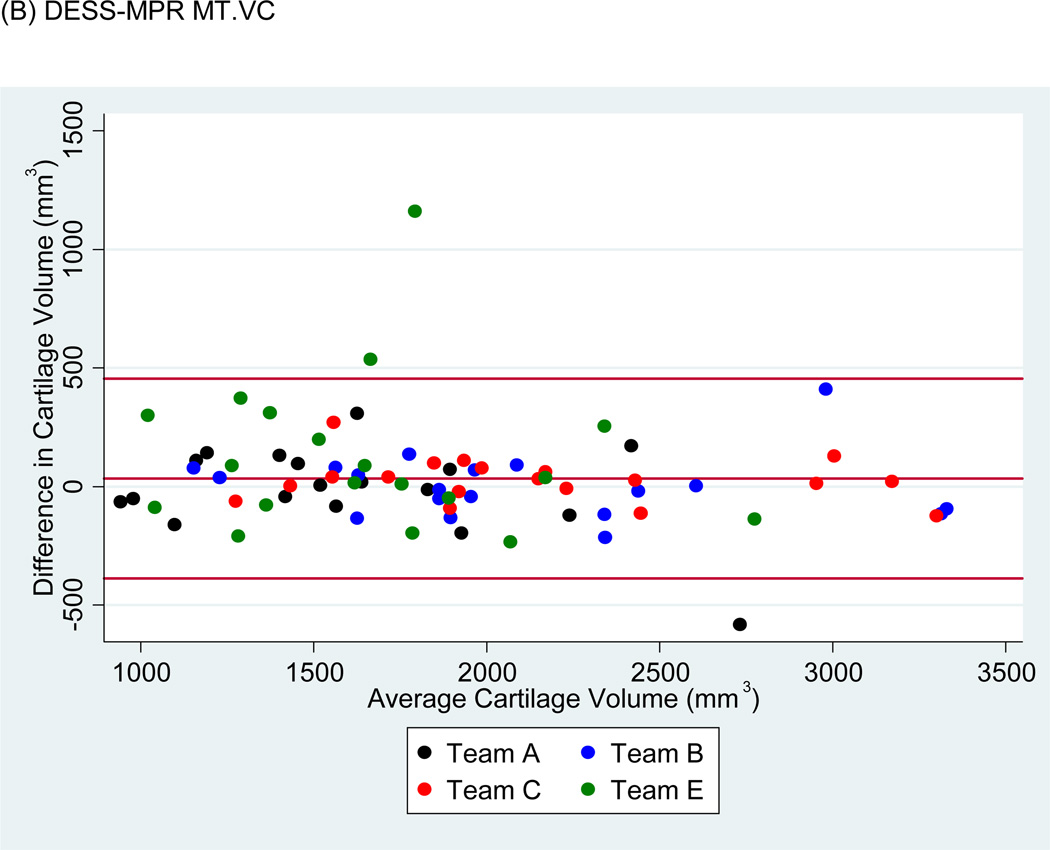
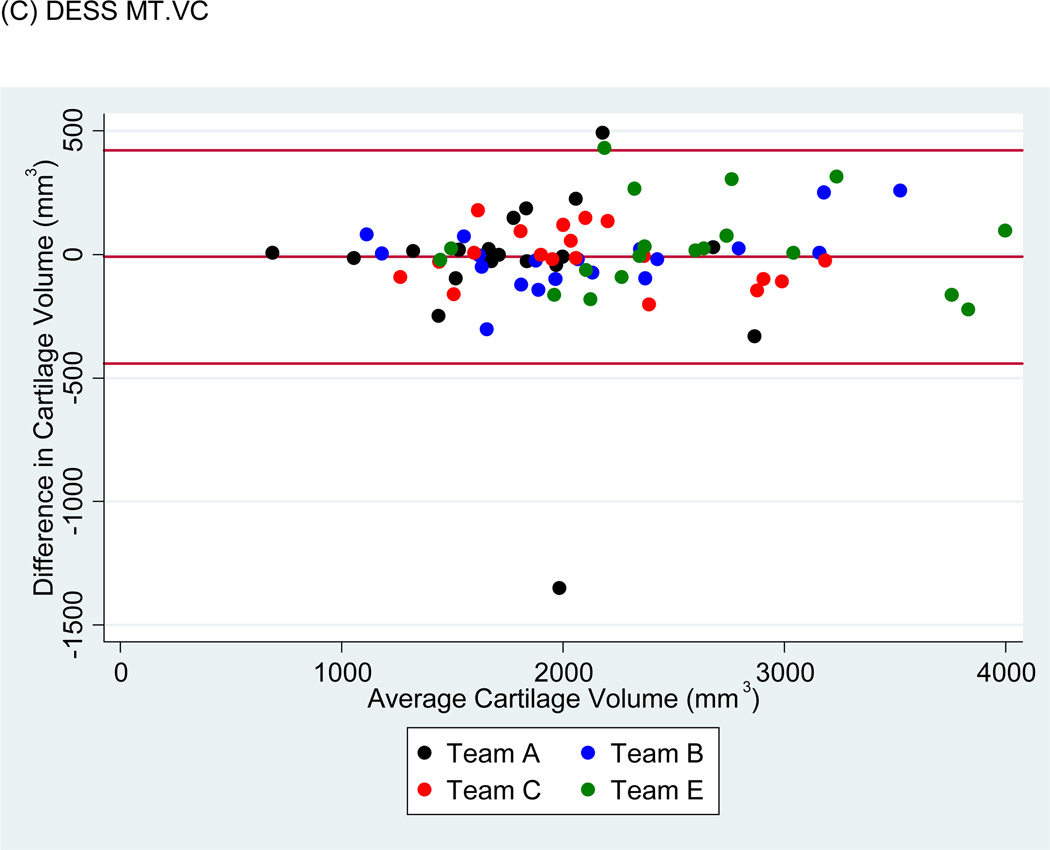
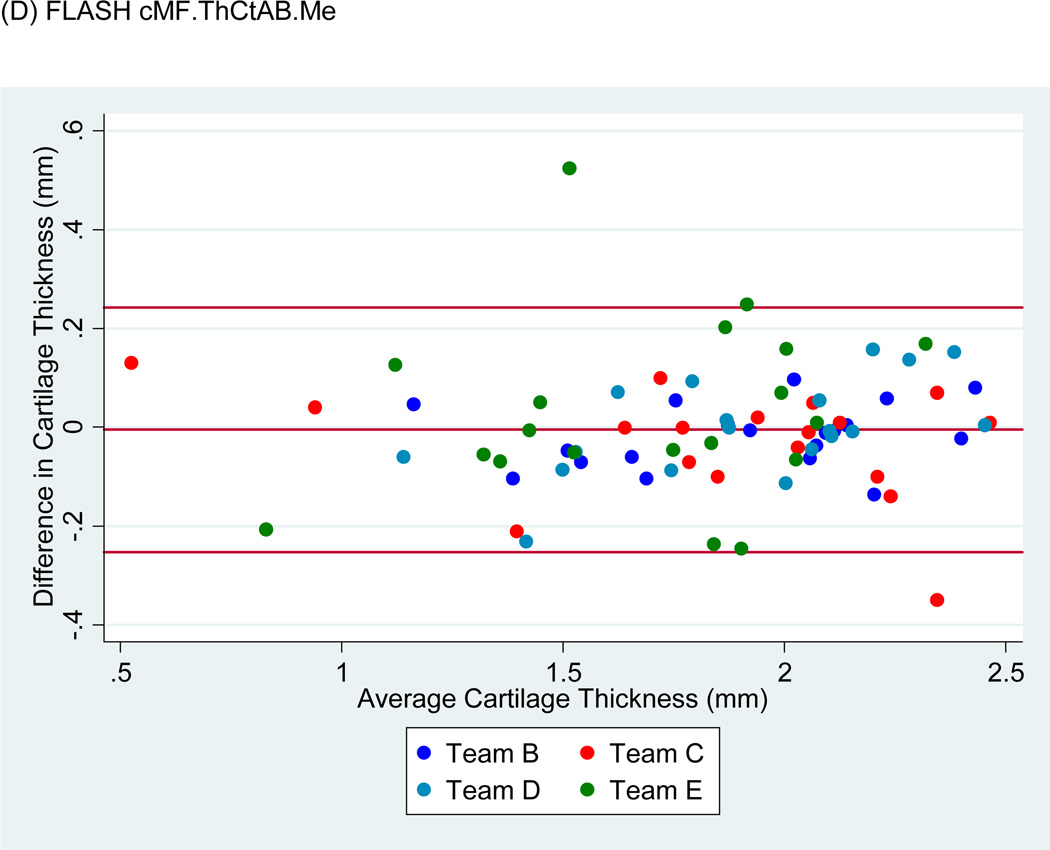
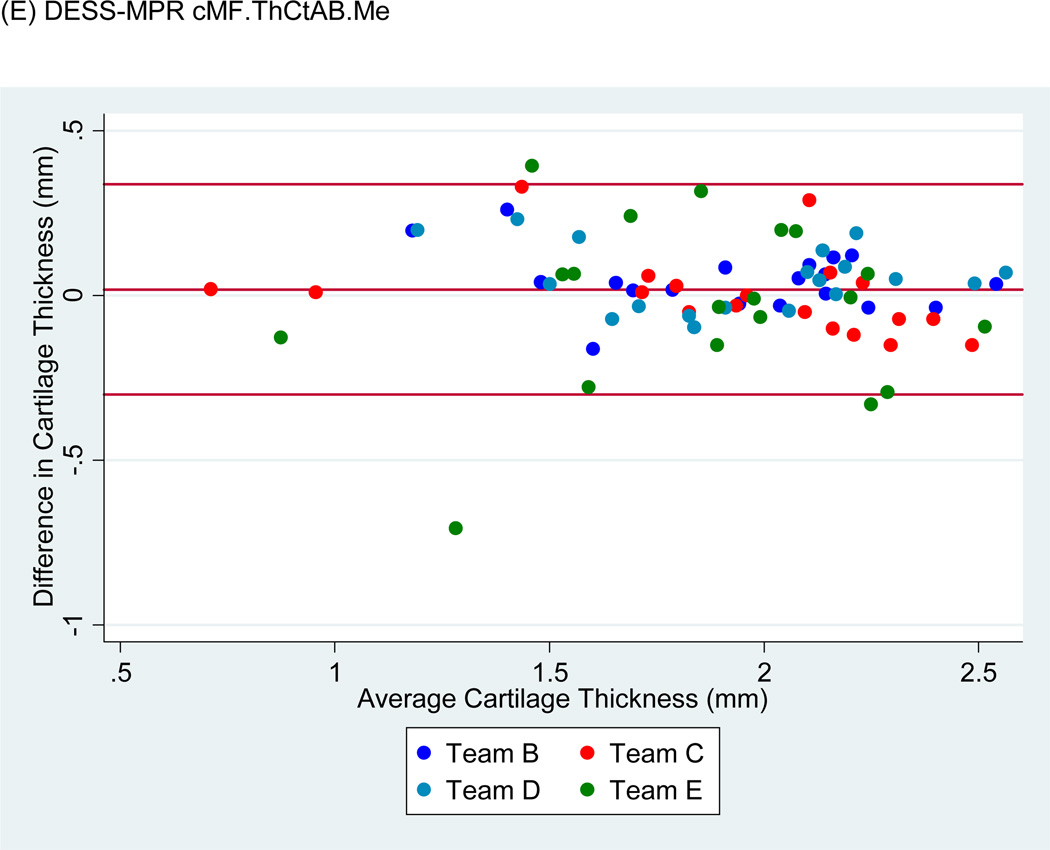
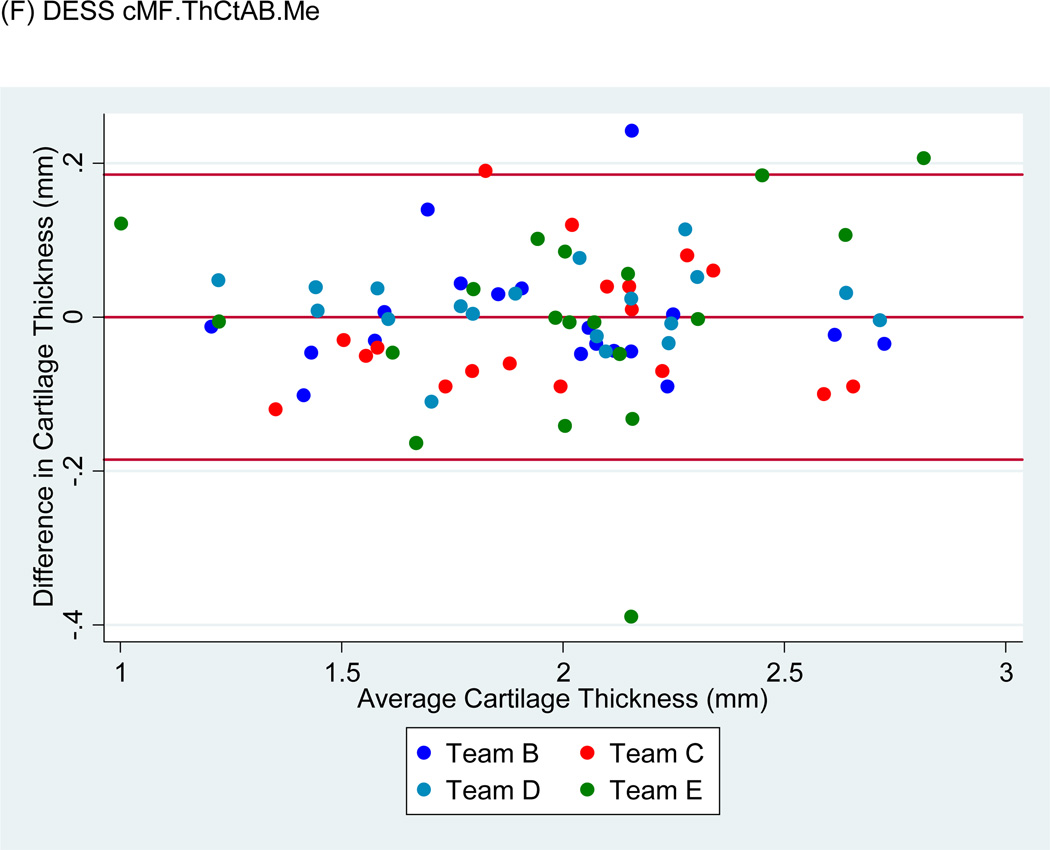
Bland-Altman plots of the test-retest values of VC and ThCtAB.Me for FLASH, DESSMPR and DESS (Fig. 4) showed all teams had points outside the 95% limits of agreement for the pooled data, with Team E having the greatest number. No trends or slopes were observed in the variance to mean associations.
Figure 4.
Sample Bland-Altman plots for (A) FLASH medial tibial cartilage volume (MT.VC), (B) DESS-MPR MT.VC, (C) DESS MT.VC, (D) FLASH central medial femoral mean cartilage thickness over the total area of bone (cMF.ThCtAB.Me), (E) DESS-MPR cMF.ThCtAB.Me, and (F) DESS cMF.ThCtAB.Me for all segmentation teams. These plots show the difference in mm3 for VC and mm for ThCtAB.Me between the different test-rest acquisitions. The x-axis corresponds to the mean value and the y-axis to the difference between test-retest values. The mean difference is the central solid line. Outliers are identified by points above and below two standard deviations (upper and lower solid lines). Each plot contains one outlier that was removed in sensitivity analyses.
Test-Retest Precision by Analysis Team, Plate and Acquisition
Cartilage Volume (VC)
For each image set and plate analyzed separately (Table 1), VC precision varied two- to five-fold between teams. VC precision showed no significant differences between teams for FLASH, but there were significant (p<0.05) team differences in precision for DESS-MPR in all four plates and for DESS in cMF. Precision estimates from pooled data for each plate and series ranged from 5.5%–9.5%, with DESS-MPR having the greatest variability (Table 1).
Table 1.
Re-measurement error (precision) for cartilage volume (VC) from unpaired analyses represented as RMSE CV%, for each cartilage plate, analysis team and acquisition for (A) medial and lateral tibia, (B) medial and lateral central femur. The combined (pooled data) RMSE CV% for a plate and acquisition combination were computed with and without the results from outlier teams. Metrics where a significant team effect on precision was observed had outlier teams identified by results that differed significantly from at least 2 other teams in pair-wise comparisons. Two isolated test-retest pair outliers for VC were excluded (values in parentheses) from MT analyses of all three acquisitions and from LT analyses of FLASH.
| (A) Medial and Lateral Tibia (MT and LT) cartilage volume (VC) | ||||||
|---|---|---|---|---|---|---|
| MT | LT | |||||
| Analysis Team |
FLASH | DESS- MPR |
DESS | FLASH | DESS- MPR |
DESS |
| A | 5.3% | 8.0% | 14.0% (6.9%) | 4.6% | 4.8% | 10.1% |
| B | 3.5% | 4.5% | 4.2% | 4.1% | 3.5% | 4.7% |
| C | 4.0% | 3.1% | 3.6% | 6.1% | 4.3% | 8.6% |
| E | 11.2% (6.2%) | 14.6% (9.6%) | 4.9% | 11.9% (4.8%) | 19.2% | 6.3% |
| Pooled, without isolated outlier data points | 4.6% (0.56) | 6.2% (0.06) | 4.9% (0.63) | 4.9% (0.7) | - | - |
| Pooled, without outlier team | - | 5.1% 1 | - | - | 4.1% 2 | - |
| Pooled (p-value for team effect) [RMSE mm3] | 5.9% (0.38) [114.7] | 7.9% (0.027) [150.1] | 7.0% (0.73) [151.6] | 6.9% (0.60) [144.5] | 9.5% (0.002) [196.3] | 7.4% (0.19) [169.8] |
| (B) Central Medial and Lateral Femur (cMF and cLF) cartilage volume (VC) | ||||||
|---|---|---|---|---|---|---|
| cMF | cLF | |||||
| Analysis Team |
FLASH | DESS- MPR |
DESS | FLASH | DESS- MPR |
DESS |
| A | -- | 8.7% | -- | -- | 9.5% | -- |
| B | 4.8% | 4.3% | 6.8% | 6.0% | 6.2% | 5.4% |
| C | 6.7% | 5.8% | 6.5% | 5.6% | 4.9% | 6.7% |
| D | 5.1% | 5.8% | 3.5% | 4.8% | 4.0% | 3.8% |
| E | 9.1% | 7.2% | 4.6% | 8.1% | 11.1% | 11.7% |
| Pooled, without outlier team | - | 4.1% 3 | - | - | 6.0% 4 | - |
| Pooled (p-value for team effect) [RMSE mm3] | 6.8% (0.09) [79.0] | 6.4% (0.05) [72.3] | 5.5% (0.03) [65.4] | 6.4% (0.98) [78.8] | 7.7% (0.01) [86.0] | 7.7% (0.63) [89.3] |
Team B and C differ (p<0.05) from E; after outlier data point removal B–E=0.11 and C–E=0.008.
Team A, B and C differ (p<0.05) from E; after outlier data point removal A–E=0.02, B–E=0.0002, and C–E=0.02.
Team B and C differ (p<0.05) from E; after outlier data point removal B–E=0.004 and C–E=0.047.
Team A, B, C and D differ (p<0.05) from E; after outlier data point removal A–E=0.003, B–E=0.002, C–E=0.03, and D–E=0.004.
When data for a given plate was pooled over teams and all three series (not in tables) there were significant differences in precision by team for MT, LT and cMF and a trend for cLF (p=0.078); team effects did not differ by image contrast or plane (two-way interactions, p>0.16).
When data for each series was pooled over teams and plates, VC precision differed by plate within each series (p<0.017), with RMSE’s significantly lower in the medial and lateral femur than the tibia for all series.
Using pooled data, no overall effect of acquisition or orientation (sagittal DESS, coronal FLASH and DESS-MPR) on precision was found either within a given plate (all p>0.22) nor for all plates combined (p=0.15). There were no pair-wise differences in precision between any two series.
Cartilage thickness (ThCtAB.Me)
CV%s for ThCtAB.Me were smaller than VC for all teams, and varied (2.6%–5.9%) by plate when pooled over teams (Table 2). Based on RMSE models, there were significant or nearly significant differences between teams in precision within each plate for all three series, with DESS-MPR having the greatest number of team differences.
Table 2.
Re-measurement error (precision) for mean cartilage thickness over the total area of bone (ThCtAB.Me) from unpaired analyses represented as RMSE CV%, for each cartilage plate, analysis team and acquisition for (A) medial and lateral tibia, (B) medial and lateral central femur. The combined (pooled data) RMSE CV% for a plate and acquisition combination were computed with and without the results from outlier teams. Metrics where a significant team effect on precision was observed had outlier teams identified by results that differed significantly from at least 2 other teams in pair-wise comparisons. Two isolated test-retest outlier pairs for ThCtAB.Me were excluded from MT analyses of DESS-MPR, for cMF and cLF analyses of FLASH and from cMF analyses of DESS-MPR.
| (A) Medial and Lateral Tibia (MT and LT) mean cartilage thickness over the total area of bone (ThCtAB.Me) | ||||||
|---|---|---|---|---|---|---|
| MT | LT | |||||
| Analysis Team |
FLASH | DESS- MPR |
DESS | FLASH | DESS- MPR |
DESS |
| B | 1.8% | 3.1% | 2.9% | 2.3% | 2.2% | 2.0% |
| C | 3.1% | 3.4% | 2.1% | 3.4% | 2.4% | 2.7% |
| D | -- | -- | -- | -- | -- | -- |
| E | 6.8% | 7.3% (4.7%) | 3.0% | 4.1% | 4.6% | 3.1% |
| Pooled, without isolated outlier data points | - | 3.6% (0.08) | - | - | - | - |
| Pooled, without outlier team | - | 3.3% | - | - | - | - |
| Pooled (p-value for team effect) [RMSE mm] | 4.6% (0.06) [0.09] | 5.1% 1 (0.04) [0.09] | 2.7% (0.89) [0.05] | 3.4% (0.64) [0.08] | 3.4% (0.07) [0.08] | 2.6% (0.02) [0.06] |
| (B) Central Medial and Lateral Femur (cMF and cLF) mean cartilage thickness over the total area of bone (ThCtAB.Me) | ||||||
|---|---|---|---|---|---|---|
| cMF | cLF | |||||
| Analysis Team |
FLASH | DESS- MPR |
DESS | FLASH | DESS- MPR |
DESS |
| B | 2.4% | 3.7% | 2.8% | 3.8% | 3.7% | 2.9% |
| C | 4.5% | 4.5% | 3.0% | 4.1% | 3.8% | 3.4% |
| D | 3.5% | 4.0% | 1.8% | 3.4% | 3.1% | 2.8% |
| E | 7.6% (5.9%) | 9.7% (7.6%) | 4.8% | 6.8% (5.6%) | 6.6% | 6.6% |
| Pooled, without isolated outlier data points | 4.1% (0.11) | 5.1% (0.14) | - | 4.2% (0.14) | - | - |
| Pooled, without outlier team | - | - | - | - | 3.5% | 3.0% |
| Pooled (p-value for team effect) [RMSE mm] | 4.7% (0.06) [0.09] | 5.9% (0.06) [0.11] | 3.3% †† (0.05) [0.06] | 4.6% (0.13) [0.08] | 4.4% 2 (0.004) [0.08] | 4.2% 2 (0.04) [0.08] |
P<0.01 for acquisition differences within a plate, all teams combined. DESS-MPR versus FLASH, P= 0.07; DESS-MPR versus DESS P<0.01.
Team B and C differ (p<0.05) from E; after outlier data point removal B–C=0.12 and C–E=0.03
Team B and D differ (p<0.05) from E; after outlier data point removal MPR: B–E=0.01 and D–E=0.006, DESS: B–E=0.02, and D–E=0.009
Pooling data over teams and all three series (not in tables), there were significant differences by team in all four plates (p<0.02); team effects did not differ by acquisition (all p>0.19). Pooling data over teams and plates, there was a trend (p=0.07) for plate differences in ThCtAB.Me precision for FLASH and DESS and a significant plate effect for DESS-MPR (p=0.01), with lateral tibial plates having better precision than femoral.
Averaged over all teams and plates, there was a significant effect of series on ThCtAB.Me precision (p=0.045). Although DESS had the lowest pooled CV% within each plate, DESS was not significantly lower than FLASH. However, DESS-MPR precision was marginally less than FLASH (p=0.07) and less than DESS (p<0.01).
Sensitivity Analyses
Exclusion of isolated test-retest outliers for VC and ThCtAB.Me and exclusion of all data from outlier teams (Tables 1 and 2) lowered the pooled CV%, especially for DESS-MPR, and slightly attenuated team effects on precision, but otherwise did not substantially change the results.
Equivalence of Cartilage Metric Values
There were significant differences (p<0.05) in mean values of VC and ThCtAB.Me by team for all series in each plate, except for DESS ThCtAB.Me in the cMF and cLF (Table 3). There were also one or more significant differences between series in cartilage values for each team (Table 3), but differences varied by team as reflected in significant series by team interactions and the fact that one team accounted for half of the 27 significant differences. Team E’s large differences in the tibial plates for sagittal versus coronal orientations were expected given their use of different plate definitions and their DESS tibial results were excluded from pooled analyses.
Table 3.
Equivalence of (A) cartilage volume (VC) and (B) mean cartilage thickness over the total area of bone (ThCtAB.Me) within each acquisition and plate combination by analysis team. P-values are from mixed model for actual values of cartilage volume including segmentation team and sequence and team by sequence interactions.
| (A) Cartilage Volume (VC) | |||||||
|---|---|---|---|---|---|---|---|
| Cartilage Plate |
Analysis team |
FLASH | DESS-MPR | DESS | FLASH vs DESS- MPR |
FLASH vs DESS |
DESS- MPR vs DESS |
| Mean VC (mm3) (SD) |
Mean VC (mm3) (SD) |
Mean VC (mm3) (SD) |
P-value | P-value | P-value | ||
| MT | A | 1855 (619) | 1637 (511) | 1777 (528) | <0.01 | 0.18 | 0.05 |
| B | 2255 (621) | 2103 (616) | 2121 (660) | <0.01 | 0.02 | 0.75 | |
| C | 2243 (594) | 2156 (589) | 2116 (549) | 0.13 | 0.03 | 0.75 | |
| Pooled A–C | 2118 (633) | 1973 (613) | 2004 (591) | <0.01 | <0.01 | 0.20 | |
| E | 1516 (432) | 1666 (478) | 2591 (718) | 0.01 | <0.01 | <0.01 | |
| Pooled A–E | 1967 (641)* | 1892 (597)* | 2151 (671)* | 0.02 | <0.01 | <0.01 | |
| Acquisition by team interaction P <0.01 | |||||||
| LT | A | 2023 (691) | 1820 (557) | 2056 (587) | <0.01 | 0.49 | <0.01 |
| B | 2413 (722) | 2308 (651) | 2352 (635) | 0.03 | 0.21 | 0.36 | |
| C | 2045 (589) | 2226 (621) | 2024 (579) | <0.01 | 0.67 | <0.01 | |
| Pooled A–C | 2160 (687) | 2126 (641) | 2144 (604) | 0.18 | 0.53 | 0.47 | |
| E | 1867 (567) | 1872 (558) | 2750 (706) | 0.93 | <0.01 | <0.01 | |
| Pooled A–E | 2087 (670)* | 2058 (630)* | 2296 (688)* | 0.30 | <0.01 | <0.01 | |
| Acquisition by team interaction P <0.01 | |||||||
| cMF | A | --- | 925 (325) | --- | --- | --- | --- |
| B | 1108 (411) | 1107 (409) | 1113 (448) | 0.97 | 0.88 | 0.85 | |
| C | 1180 (411) | 1186 (410) | 1244 (400) | 0.92 | 0.07 | 0.09 | |
| D | 1096 (362) | 1128 (393) | 1176 (429) | 0.34 | 0.02 | 0.15 | |
| E | 1247 (415) | 1281 (448) | 1213 (359) | 0.32 | 0.30 | 0.04 | |
| Pooled B–E | 1159 (397)* | 1175‡ (412)* | 1186 (409)* | 0.27 | 0.10 | 0.49 | |
| Acquisition by team interaction P = 0.08 | |||||||
| cLF | A | --- | 837 (288) | --- | --- | --- | --- |
| B | 1140 (383) | 1155 (400) | 1101 (406) | 0.54 | 0.13 | 0.02 | |
| C | 1272 (408) | 1240 (381) | 1186 (364) | 0.14 | <0.01 | 0.03 | |
| D | 1133 (340) | 1135 (329) | 1151 (386) | 0.93 | 0.48 | 0.53 | |
| E | 1354 (361) | 1286 (442) | 1218 (413) | <0.01 | <0.01 | <0.01 | |
| Pooled B–E | 1226 (377)* | 1204‡ (400)* | 1164 (387)* | 0.08 | <0.01 | <0.01 | |
| Acquisition by team interaction P <0.01 | |||||||
| (B) Mean cartilage thickness over the total area of bone (ThCtAB.Me) | |||||||
|---|---|---|---|---|---|---|---|
| Cartilage Plate |
Analysis Team |
FLASH | DESS-MPR | DESS | FLASH vs DESS- MPR |
FLASH vs DESS |
DESS- MPR vs DESS |
| ThCtAB.Me (mm) (SD) |
ThCtAB.Me (mm) (SD) |
ThCtAB.Me (mm) (SD) |
P | P | P | ||
| MT | B | 1.90 (0.28) | 1.81 (0.27) | 1.79 (0.28) | <0.01 | <0.01 | 0.02 |
| C | 1.85 (0.25) | 1.77 (0.26) | 1.79 (0.28) | 0.03 | 0.02 | 0.51 | |
| Pooled B–C | 1.88 (0.27) | 1.79 (0.27) | 1.79 (0.28) | <0.01 | <0.01 | 0.88 | |
| E | 2.01 (0.31) | 1.88 (0.29) | 1.94 (0.32) | <0.01 | <0.01 | 0.02 | |
| Pooled B–E | 1.92 (0.29)* | 1.82 (0.27)* | 1.84 (0.30)* | <0.01 | <0.01 | 0.20 | |
| Acquisition by team interaction P =0.10 | |||||||
| LT | B | 2.14 (0.25) | 2.11 (0.25) | 2.13 (0.26) | 0.36 | 0.66 | 0.63 |
| C | 2.07 (0.23) | 2.16 (0.23) | 2.03 (0.21) | <0.01 | 0.15 | <0.01 | |
| Pooled B–C | 2.11 (0.25) | 2.14 (0.24) | 2.08 (0.24) | 0.02 | 0.02 | <0.01 | |
| E | 2.51 (0.35) | 2.43 (0.40) | 2.15 (0.31) | 0.01 | <0.01 | <0.01 | |
| Pooled B–E | 2.24 (0.34)* | 2.23 (0.33)* | 2.10 (0.27)* | 0.75 | <0.01 | <0.01 | |
| Acquisition by team interaction P <0.01 | |||||||
| cMF | B | 1.91 (0.34) | 1.93 (0.35) | 1.94 (0.39) | 0.56 | 0.44 | 0.85 |
| C | 1.86 (0.49) | 1.92 (0.47) | 2.00 (0.36) | 0.22 | 0.06 | 0.33 | |
| D | 1.91 (0.35) | 1.95 (0.37) | 1.96 (0.40) | 0.41 | 0.25 | 0.74 | |
| E | 1.69 (0.38) | 1.85 (0.42) | 2.01 (0.43) | <0.01 | <0.01 | <0.01 | |
| Pooled | 1.84 (0.40)* | 1.91 (0.40)* | 1.98 (0.39) | <0.01 | <0.01 | <0.01 | |
| Acquisition by team interaction P <0.01 | |||||||
| cLF | B | 1.87 (0.33) | 1.91 (0.34) | 1.84 (0.34) | 0.19 | 0.32 | 0.03 |
| C | 1.86 (0.32) | 1.84 (0.32) | 1.85 (0.34) | 0.55 | 0.80 | 0.73 | |
| D | 1.84 (0.35) | 1.87 (0.35) | 1.81 (0.35) | 0.31 | 0.47 | 0.08 | |
| E | 1.67 (0.28) | 1.77 (0.41) | 1.89 (0.41) | <0.01 | <0.01 | <0.01 | |
| Pooled | 1.81 (0.33)* | 1.85 (0.36)* | 1.85 (0.36) | 0.02 | <0.01 | <0.01 | |
| Acquisition by team interaction P <0.01 | |||||||
P <0.05 for team effect within plate and acquisition
Team A not included in pooled means.
In analyses of the mean values pooled across teams and series, FLASH MT.VC was 4% and 6% greater than DESS-MPR and DESS, respectively, while FLASH cLF.VC was 5% greater than DESS. FLASH MT.ThCtAB.Me was 5–6% greater than DESS-MPR and DESS, but in cMF was 4–8% less than the two DESS series. Despite these plate-specific differences by series, in all plates combined there were no consistent effects of image contrast on either cartilage metric (VC and ThCtAB.Me).
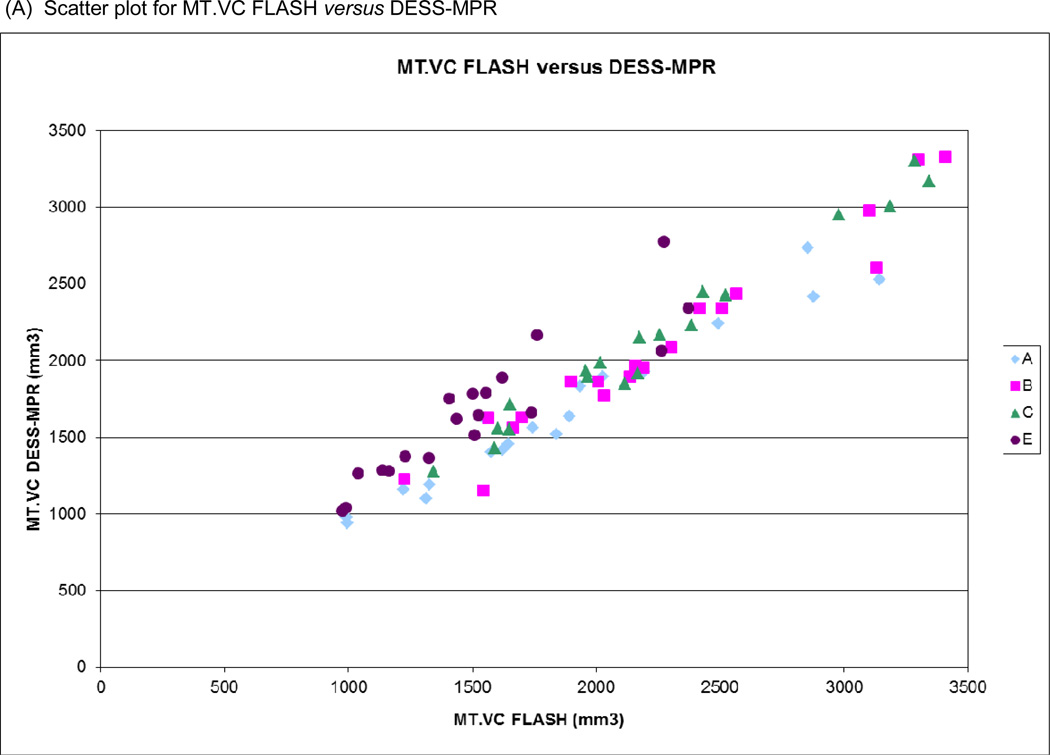
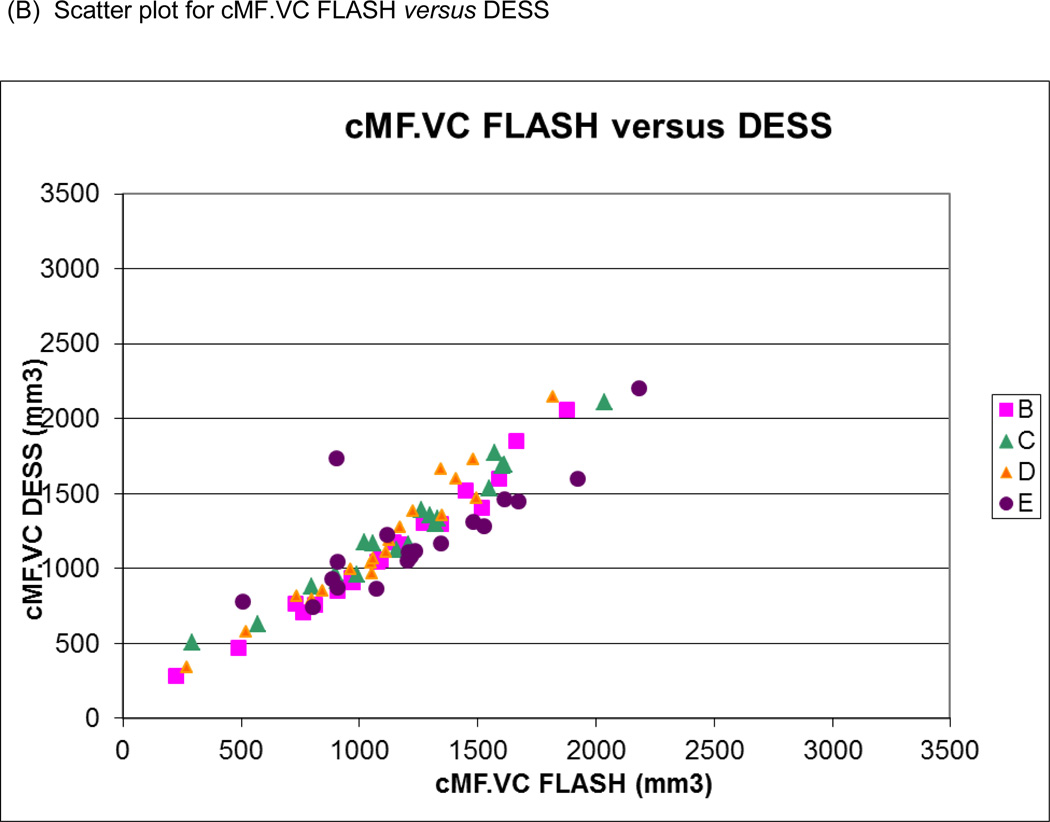
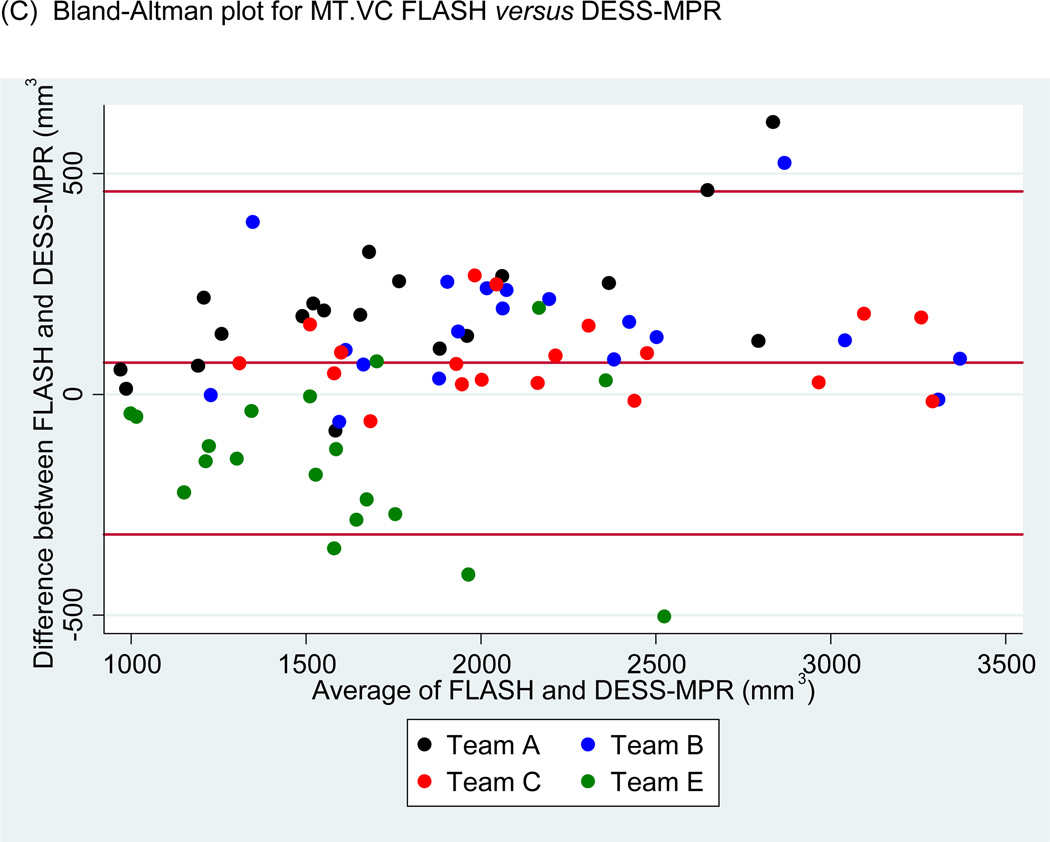
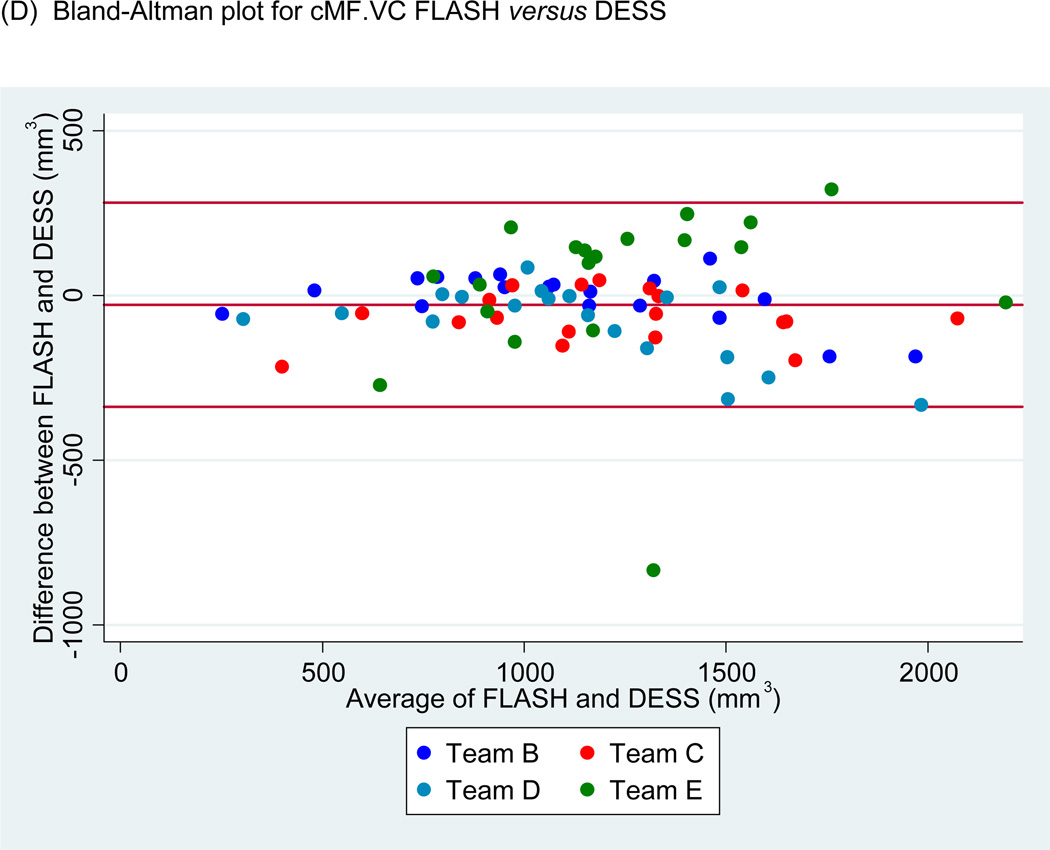
Pearson correlation coefficients (r) for VC and ThCtAB.Me for FLASH versus DESS-MPR and FLASH versus DESS using pooled data from all teams are shown in Table 4 with example scatter and Bland-Altman plots in Figure 5. Correlations for tibial plates were uniformly high (r=0.94–0.97) and were only slightly lower for femoral plates (r=0.90–0.95), with the exception of FLASH versus DESS ThCtAB.Me, which were substantially lower (r=0.81–0.83). For the latter, exclusion of one team with individual correlations below 0.88 substantially increased the pooled correlations (r=0.90–0.91).
Table 4.
Mean differences (SD of differences) and Pearson correlation coefficients (r) for cartilage volume (VC) and mean cartilage thickness over the total area of bone (ThCtAB.Me) for (A) FLASH versus DESS-MPR and (B) FLASH versus DESS from the pooled data. Team E did not use identical regions of interest for FLASH versus DESS for medial tibia (MT) and lateral tibia (LT) and their data was eliminated from the comparison in these plates. For comparison of FLASH versus DESS ThCtAB.Me, exclusion of one team with individual femoral correlations below 0.88 substantially increased the pooled correlations (r=0.90–0.91).
| (A) FLASH versus DESS-MPR | ||||
|---|---|---|---|---|
| VC | ThCtAB.Me | |||
| Mean Difference (SD of differences) |
r | Mean Difference (SD of differences) |
r | |
| MT | 71.3 (194.2) | 0.95 | 0.10 (0.09) | 0.95 |
| LT | 24.9 (233.9) | 0.94 | 0.01 (0.11) | 0.95 |
| cMF | −17.0 (136.2) | 0.94 | −0.07 (0.14) | 0.94 |
| cLF | 21.9 (117.9) | 0.95 | −0.04 (0.15) | 0.90 |
| (B) FLASH versus DESS | ||||
|---|---|---|---|---|
| VC | ThCtAB.Me | |||
| Mean Difference (SD of differences) |
r | Mean Difference (SD of differences) |
r | |
| MT | 113.1 (198.5) | 0.95 | 0.08 (0.10) | 0.97 |
| LT | 16.1 (198.0) | 0.96 | 0.14 (0.19) | 0.95 |
| cMF | −27.8 (155.2) | 0.93 | −0.13 (0.25) | 0.81 |
| cLF | 62.1 (117.6) | 0.95 | −0.04 (0.20) | 0.83 |
Figure 5.
Scatter plots of (A) medial tibial cartilage volume (MT.VC) for FLASH versus DESS-MPR and (B) central medial femoral cartilage volume (cMF.VC) for FLASH versus DESS for all segmentation teams. Bland-Altman plots for (C) MT.VC for FLASH versus DESS-MPR and (D) cMF.VC for FLASH versus DESS.
Discussion
Considerable effort has been invested into developing imaging biomarkers to quantitatively evaluate joint structure and function and to sensitively monitor OA progression[5, 7, 10]. Radiographic joint space narrowing is the only method accepted by the Food and Drug Administration for demonstrating structure-modifying effects of OA treatments[25]. However, radiography has technical challenges and only infers changes[29], thus direct cartilage visualization and quantification using MR has been investigated[5, 6, 10]. Information on the performance characteristics of MR-based cartilage metrics is needed to qualify them for use in OA research. We investigated the effects of MR image contrast, orientation and segmentation method on test-retest precision and cartilage metric values. We pooled data from multiple segmentation teams to directly compare knee cartilage measurements and used multivariate analysis to test for the independent effects of image contrast, image plane, segmentation team, and plate on precision and cartilage metric values. This study provides insight into the average (and range) of, performance from different acquisitions and segmentation methods.
Precision and equivalence of two cartilage metrics (VC and ThCtAB.Me) were compared from four independent segmentation teams using identical MR images from three series: sagittal DESS, coronal DESS-MPR, and coronal FLASH. Because FLASH had been previously validated[6, 7, 11, 15, 16, 26, 30, 31], we treated it as the gold standard. Coronal FLASH was compared to coronal DESS-MPR which has different image contrast and slightly lower in-plane spatial resolution; FLASH was also compared to sagittal DESS, a comparison which added the complexity of a different plane. Our results are consistent with previous publications comparing quantitative morphology from sagittal DESS and coronal FLASH acquisitions, which showed similar precision but some differences between acquisitions in mean values of cartilage metrics[18, 19, 22, 45, 47].
Using data pooled across segmentation teams, no significant differences were found in the test-retest precision of either VC or ThCtAB.Me in femorotibial cartilage plates for FLASH compared to DESS-MPR or DESS. While DESS CV% for ThCtAB.Me were slightly smaller than the other series, its precision was significantly better compared only to DESS-MPR in the cMF. This may suggest a relatively greater ease of segmenting central femoral cartilage regions in the sagittal plane or the thinner slices of the sagittal DESS minimize the potential impact of partial volume effects[26, 32].
Several plate-specific offsets in mean values were observed for VC and ThCtAB.Me between FLASH and DESS image contrasts. FLASH values for MT.VC and MT.ThCtAB.Me were about 5% higher than mean values for DESS image contrast (excluding Team E’s sagittal DESS values). A similar small underestimation in MT for DESS compared to FLASH was previously reported[19], but was not found in a separate comparison of the two image contrasts[47]. The magnitude of the mean MT offsets are comparable to that seen between FLASH images acquired at 1.5T and 3T[11]. Differences between acquisitions in mean cartilage values in LT and cLF were inconsistent and varied both in magnitude and direction. As a result, no overall differences were found between series for all cartilage regions combined. A previous analysis combining tibial and central femoral regions of the same images found a significant, but not clinically meaningful, underestimation (1.5%) by DESS compared to FLASH in ThCtAB.ME, but no differences in VC[22].
Using pooled data from all teams, VC and ThCtAB.me from FLASH correlated highly with DESS-MPR and DESS and were similar to those previously reported (r>0.90)[47]. They are also similar to correlations of FLASH acquisitions at 1.5 and 3T (r=0.95–0.97). However, our coronal FLASH versus sagittal DESS correlations for cMF.ThCtAB.Me (r=0.81–0.83) were somewhat lower than prior studies. This was attributed to differences in femoral ROI definition in the coronal and sagittal planes by one team. When the outlier team was eliminated from the cMF.ThCtAB.Me analysis, the correlations were significantly higher (0.90–0.91). While a high degree of equivalence was found between acquisitions in both VC and ThCtAB.Me, this varied somewhat by cartilage plate. The potential for systematic offsets between acquisitions in cartilage metrics for some regions suggests that cross-sectional analyses pooling data from different acquisitions and orientations may be feasible, but should include statistical adjustment of offsets.
Differences between teams dominated the variability in both precision and mean cartilage metric values and potentially overshadow the impacts of image contrast, plane and cartilage plate. Of the 24 combinations of acquisition and cartilage region, there were significant or nearly significant differences in precision by team for 15, and in cartilage metric values by team for 22. Between-team ranges in precision and mean values were several-fold greater than the range among series for the same plate. These team differences probably reflect subtle variations in region definitions, segmentation methods and calculation techniques. The consensus definitions of the cartilage plates used in this study differed from those typically used by some of the teams. Moreover, the teams did not have equivalent experience analyzing images in both the coronal and sagittal planes and none had prior experience with DESS contrast, which may explain the greater variability in precision among teams for DESS. This suggests that VC and ThCtAB.Me from different segmentation teams, even based on the same MR acquisition, should not be pooled in cross-sectional (or possibly even longitudinal) studies without evidence of comparable precision and equivalence for the metrics of interest and possibly including statistical adjustment for team offsets. This situation is analogous to DEXA wherein it is well established that the same scanner, calibration phantoms, and segmentation software must be used to compare baseline and followup images[52].
We assessed precision for repeated acquisitions using segmentation of unpaired images, so our results cannot be directly compared to precision in which test-retest images were paired for segmentation[11, 19, 28, 33, 36, 41, 45–48, 54]. Unpaired segmentation of test-retest images has more variability than paired analyses[19, 32], but also has the advantage of eliminating potential reader bias toward “no difference” when viewing repeat scans together and may therefore be more sensitive to impacts of contrast and plane on short-term reproducibility. Although the precision errors reported here overestimate what is achieved with paired analyses[47] and some team- and plate-specific reproducibility was poor, precision in all teams combined was comparable to that seen in other unpaired segmentations[7,26,32,51].
Precision errors were lower for cartilage thickness than for volume both for individual teams and for each plate and series pooled over teams. This is understandable because each individual ThCtAB measurement is one component of the volume measurement, and indicates that variability in selecting the same cartilage ROI will contribute to, and increase, the variability of unpaired segmentation. Better precision for cartilage thickness compared to volume has also been seen with paired image analyses in some[18,51,52,54] but not all[11, 32] studies. Smaller precision errors may contribute to a greater sensitivity to change of ThCtAB.me than for VC [46,47,52,54]. The pooled precision estimates for cMF.VC and cLF.VC were better than in the tibia, while for ThCtAB.Me the teams performed better in tibial than femoral regions.
Our cross-sectional findings of precision similarity and general equivalence of cartilage metrics between DESS and FLASH do not suggest a preferred MR acquisition. However, FLASH acquisitions are considered a gold standard, are available from all manufacturers, and have been used in many clinical studies of cartilage loss [11,12,16,28, 30,33,35,44,53], albeit often in a sagittal orientation. Independent analyses of baseline and follow-up OAI images have shown that FLASH, DESS-MPR and DESS provide very similar sensitivity to change in cartilage thickness[45,47] and further supports our findings of equivalent cartilage metrics resulting from DESS and FLASH. DESS has the advantage of higher SNR, faster acquisition times, and the potential for thinner slices. The key item remaining to be addressed is image plane, since sagittal acquisitions covers all cartilage plates (including the patella and trochlea) and allows high quality MPRs. On the other hand, coronal acquisitions have the potential for reduced partial volume in weight-bearing femorotibial cartilage, however this may not yield superior precision or sensitivity to change[54]. Thinner sagittal slices increase the number of images to be segmented, however analysis of every other slice[47] has shown to provide the same sensitivity to change as segmenting all slices.
The current study has several limitations, including the small number of subjects (N=19), a relatively low grade of OA, the lack of intra- and inter-rater assessments, and not evaluating the patello-femoral compartment. However, both precision and equivalence results are consistent with analyses performed in larger and independent samples of images including knees with more severe disease[33, 36, 45–47]. Segmentation of the patello-femoral joint is outside the scope of this study and would require different gold standard acquisitions and different orientation MPRs for effective analysis. Another limitation is that FLASH used a 1.5 mm slice thickness, however studies have shown that 1.0 mm slice thickness is practical at 3T and yields somewhat greater precision than acquisitions with 1.5 mm[11]. Finally, results from this cross-sectional study are not directly generalizable to longitudinal measures of cartilage loss, which needs to be evaluated using longitudinal test-retest data for the specific combination of acquisition and segmentation method under consideration [18,32,45,55,56]. In particular, our precision is based on blinded, unpaired segmentation of cross-sectional test-retest exams whereas longitudinal studies typically utilize paired segmentation[8,9,36,39].
In conclusion, this study represents one component of the multi-step process for qualifying quantitative cartilage metrics obtained from a direct or multi-planar reformatted sagittal DESS acquisition. The pooled analysis of test-retest measurements by four independent segmentation teams showed that DESS and FLASH image contrast are equivalent for cross-sectional segmentation of cartilage metrics and that multi-planar reformatted images can be used to provide equivalent results to directly acquired image sets. The results do not support pooling of data from different segmentation teams for any metrics even using prospectively agreed upon anatomic region definitions. On the other hand, pooling VC and ThCtAB.Me data from different image contrast and orientation may be possible for cross-sectional analyses, but should be undertaken cautiously for a given segmentation method on a plate-specific basis and include assessments of potential offsets in mean values.
Acknowledgements
The Osteoarthritis Initiative (OAI) and this pilot study are conducted and supported by the National Institute of Arthritis and Musculoskeletal and Skin Diseases in collaboration with the OAI Investigators and Consultants. The research reported in this article was supported in part by contracts N01-AR-2-2261, N01-AR-2-2262 and N01-AR-2-2258 from NIAMS.
We are grateful to the Ohio State University team, particularly Larry Martin, BS RT(R), MR, Kim Toussant, and Rebecca Jackson, MD, and to the Lynn Fanella, BS, RT(R), MR, Gretchen Sloane, RN, and Charles Eaton, MD at Memorial Hospital of Rhode Island for recruitment of the study subjects and acquisition of the MR exams. In addition, we are grateful to David White, PhD at Synarc, Inc. for helping with the initial pilot study setup and initial image de-identification, Fran Harris and Alexandra Hernandez at University of California, San Francisco for statistical analysis, and David Felson, MD, MPH at Boston University for consulting on study design. We are grateful to the individual segmentation teams for their continued assistance, education, and participation in OAI and this pilot MR study.
FE would like to thank Martin Hudelmaier, Wolfgang Wirth, Gudrun Goldmann, Linda Jakobi, Manuela Kunz, Sabine Mühlsimer, Matt Schutzer and Annette Thebis for data segmentation and processing, and Chondrometrics GmbH (Ainring, Germany) for providing the software for data segmentation and computation of quantitative morphological metrics.
JD would like to thank Hiroshi Yoshioka, Gesa Neumann, Matthias Brem, Philipp Schlechtweg, Inez Wu, Carl Winalski, and Philipp Lang. This work was also supported in part by a contract with the NIH/NIAMS intramural program (JD) “3D segmentation of the carpal bones on wrist CT scans.”
FC would like to acknowledge the help of F Hanna, Anita Wluka and Kevin Morris for advice on measurement.
Footnotes
Publisher's Disclaimer: This is a PDF file of an unedited manuscript that has been accepted for publication. As a service to our customers we are providing this early version of the manuscript. The manuscript will undergo copyediting, typesetting, and review of the resulting proof before it is published in its final citable form. Please note that during the production process errors may be discovered which could affect the content, and all legal disclaimers that apply to the journal pertain.
Conflicts of Interest
MN and CM were supported by a contract from NIAMS/NIH N01-AR-2-2258 as the coordinating center for the OAI. FMC, JD, FE, JTP, and ES were supported in part by a subcontract from the coordinating center contract to perform this pilot study and analysis.
ES has a fee for service contract with NIAMS as the NIAMS OAI Technical Advisor.
FMC, no conflicts.
JD, no conflicts.
FE is CEO of Chondrometrics GmbH, a company providing MR image segmentation services. He provides consulting services to MerckSerono, Novartis, Sanofi-Aventis and Perceptive, and has recently received speaking honoraria from Merck, Genzyme, Glaxo Smith Kline, Synthes, and Medtronic.
JTP, is a shareholder of VirtualScopics, Inc, he is also a founder and shareholder of QMetrics Technology, LLC, as well as a founder and shareholder of IMITEK.
Authors Contributions
All authors have made substantial contributions to (a) the conception and design of the study, (b) acquisition of the data, (c) analysis or (d) interpretation of the data, (e) drafting the manuscript, (f) revising it critically for important intellectual content, and / or (g) final approval of the submitted version.
- conception and design of the study: MN, CM, FE, ES
- acquisition of the data: ES
- analysis of the data: FE, FMC, JTP, JD, ES
- interpretation of the data: MN, CM, FE, JTP, FCM, JD, ES
- drafting the manuscript: ES, MN, CM
- revising the manuscript critically for important intellectual content: FE, FMC, JTP, JD, MN, CM, ES
- final approval of the submitted manuscript: FE, FMC, JTP, JD, MN, CM, ES
References
- 1.Pleis JR, Lethbridge-Cejku M. Summary health statistics for U.S. adults: National Health Interview Survey, 2005. Vital Health Stat. 2006;10:1–153. [PubMed] [Google Scholar]
- 2.Felson DT, Lawrence RC, Hochberg MC, McAlindon T, Dieppe PA, Minor MA, et al. Osteoarthritis: new insights. Part 2: treatment approaches. Ann Intern Med. 2000;133:726–737. doi: 10.7326/0003-4819-133-9-200011070-00015. [DOI] [PubMed] [Google Scholar]
- 3. www.oai.ucsf.edu and https://niams-imaging.nci.nih.gov/ncia/login.jsf.
- 4.Peterfy CG, Schneider E, Nevitt M. The osteoarthritis initiative: report on the design rationale for the magnetic resonance imaging protocol for the knee. Osteoarthritis Cartilage. 2008;16:1433–1441. doi: 10.1016/j.joca.2008.06.016. [DOI] [PMC free article] [PubMed] [Google Scholar]
- 5.Peterfy CG, Gold G, Eckstein F, Cicuttini F, Dardzinski B, Stevens R. MRI protocols for whole-organ assessment of the knee in osteoarthritis. Osteoarthritis Cartilage. 2006;14(Suppl A):A95–A111. doi: 10.1016/j.joca.2006.02.029. [DOI] [PubMed] [Google Scholar]
- 6.Zhai G, Ding C, Cicuttini F, Jones G. Optimal sampling of MRI slices for the assessment of knee cartilage volume for cross-sectional and longitudinal studies. BMC Musculoskelet Disord. 2005;6:10. doi: 10.1186/1471-2474-6-10. [DOI] [PMC free article] [PubMed] [Google Scholar]
- 7.Eckstein F, Cicuttini F, Raynauld JP, Waterton JC, Peterfy C. Magnetic resonance imaging (MRI) of articular cartilage in knee osteoarthritis (OA): morphological assessment. Osteoarthritis Cartilage. 2006;14(Suppl A):A46–A75. doi: 10.1016/j.joca.2006.02.026. [DOI] [PubMed] [Google Scholar]
- 8.Eckstein F, Mosher T, Hunter D. Imaging of knee osteoarthritis: data beyond the beauty. Curr Opin Rheumatol. 2007;19:435–443. doi: 10.1097/BOR.0b013e328248b4be. [DOI] [PubMed] [Google Scholar]
- 9.Eckstein F, Guermazi A, Roemer FW. Quantitative MR imaging of cartilage and trabecular bone in osteoarthritis. Radiol Clin North Am. 2009;47:655–673. doi: 10.1016/j.rcl.2009.03.002. [DOI] [PubMed] [Google Scholar]
- 10.Peterfy C, Woodworth T, Altman R. Workshop for Concensus on Osteoarthritis Imaging: MRI of the Knee. Osteoarthritis Cartilage. 2006;14:44–45. [Google Scholar]
- 11.Eckstein F, Charles HC, Buck RJ, Kraus VB, Remmers AE, Hudelmaier M, et al. Accuracy and precision of quantitative assessment of cartilage morphology by magnetic resonance imaging at 3.0T. Arthritis Rheum. 2005;52:3132–3136. doi: 10.1002/art.21348. [DOI] [PubMed] [Google Scholar]
- 12.Raynauld JP, Martel-Pelletier J, Berthiaume MJ, Beaudoin G, Choquette D, Haraoui B, et al. Long term evaluation of disease progression through the quantitative magnetic resonance imaging of symptomatic knee osteoarthritis patients: correlation with clinical symptoms and radiographic changes. Arthritis Res Ther. 2006;8:R21. doi: 10.1186/ar1875. [DOI] [PMC free article] [PubMed] [Google Scholar]
- 13.Disler DG. Fat-suppressed three-dimensional spoiled gradient-recalled MR imaging: assessment of articular and physeal hyaline cartilage. Am J Roentgenol. 1997;169:1117–1123. doi: 10.2214/ajr.169.4.9308475. [DOI] [PubMed] [Google Scholar]
- 14.Hardy PA, Recht MP, Piraino D, Thomasson D. Optimization of a dual echo in the steady state (DESS) free-precession sequence for imaging cartilage. J Magn Reson Imaging. 1996;6:329–335. doi: 10.1002/jmri.1880060212. [DOI] [PubMed] [Google Scholar]
- 15.Graichen H, von Eisenhart-Rothe R, Vogl T, Englmeier KH, Eckstein F. Quantitative assessment of cartilage status in osteoarthritis by quantitative magnetic resonance imaging: technical validation for use in analysis of cartilage volume and further morphologic parameters. Arthritis Rheum. 2004;50:811–816. doi: 10.1002/art.20191. [DOI] [PubMed] [Google Scholar]
- 16.Eckstein F, Buck RJ, Burstein D, Charles HC, Crim J, Hudelmaier M, et al. Precision of 3.0 Tesla quantitative magnetic resonance imaging of cartilage morphology in a multicentre clinical trial. Ann Rheum Dis. 2008;67:1683–1688. doi: 10.1136/ard.2007.076919. [DOI] [PubMed] [Google Scholar]
- 17.Tamez-Pena J, Barbu-McInnes M, Buck RJ, Totterman S. Cross validation of Fused SPGR=GRE T2* MRI at 1.5T and 3.0T for Morphological Cartilage Analysis. Osteoarthritis and Cartilage. 2005;vol. 12(Supplement 2):S1–S2. [Google Scholar]
- 18.Eckstein F, Kunz M, Schutzer M, Hudelmaier M, Jackson RD, Yu J, et al. Two year longitudinal change and test-retest-precision of knee cartilage morphology in a pilot study for the osteoarthritis initiative. Osteoarthritis Cartilage. 2007;15:1326–1332. doi: 10.1016/j.joca.2007.04.007. [DOI] [PMC free article] [PubMed] [Google Scholar]
- 19.Eckstein F, Hudelmaier M, Wirth W, Kiefer B, Jackson R, Yu J, et al. Double echo steady state magnetic resonance imaging of knee articular cartilage at 3 Tesla: a pilot study for the Osteoarthritis Initiative. Ann Rheum Dis. 2006;65:433–441. doi: 10.1136/ard.2005.039370. [DOI] [PMC free article] [PubMed] [Google Scholar]
- 20.Brem MH, Pauser J, Yoshioka H, Brenning A, Stratmann J, Hennig FF, et al. Longitudinal in vivo reproducibility of cartilage volume and surface in osteoarthritis of the knee. Skeletal Radiol. 2007;36:315–320. doi: 10.1007/s00256-006-0208-z. [DOI] [PubMed] [Google Scholar]
- 21.Duryea J, Neumann G, Brem MH, Koh W, Noorbakhsh F, Jackson RD, et al. Novel fast semi-automated software to segment cartilage for knee MR acquisitions. Osteoarthritis Cartilage. 2007;15:487–492. doi: 10.1016/j.joca.2006.11.002. [DOI] [PMC free article] [PubMed] [Google Scholar]
- 22.Tamez-Pena J, Barbu-McInnes M, Jackson R, Yu J, Eaton CB, Totterman S. Cartilage Quantification: Comparison between 3T DESS and 3T FLASH Sequences. Osteoarthritis and Cartilage. 2005;vol. 13(Supplement A):S124. [Google Scholar]
- 23.Tamez-Pena J, Barbu-McInnes M, Jackson R, Yu J, Eaton CB, Totterman S. Bone-Cartilage Contrast Ratio (BCCR) from MRI DESS Sequence: Signal-based Quantitative biomarker in OA Studies. American College of Rheumatology. 2005:92. [Google Scholar]
- 24.Eckstein F, Kunz M, Hudelmaier M, Jackson R, Yu J, Eaton CB, et al. Impact of coil design on the contrast-to-noise ratio, precision, and consistency of quantitative cartilage morphometry at 3 Tesla: a pilot study for the osteoarthritis initiative. Magn Reson Med. 2007;57:448–454. doi: 10.1002/mrm.21146. [DOI] [PubMed] [Google Scholar]
- 25.Altman R, Brandt KD, Hochberg MC, Moskowitz R. Design and conduct of clinical trials in patients with osteoarthritis: recomendations from a task force of the Osteoarthritis Research Society. Osteoarthritis and Cartilage. 1996;4:217–243. doi: 10.1016/s1063-4584(05)80101-3. [DOI] [PubMed] [Google Scholar]
- 26.Glaser C, Burgkart R, Kutschera A, Englmeier KH, Reiser M, Eckstein F. Femoro-tibial cartilage metrics from coronal MR image data: Technique, test-retest reproducibility, and findings in osteoarthritis. Magn Reson Med. 2003;50:1229–1236. doi: 10.1002/mrm.10648. [DOI] [PubMed] [Google Scholar]
- 27.Eckstein F, Ateshian G, Burgkart R, Burstein D, Cicuttini F, Dardzinski B, et al. Proposal for a nomenclature for magnetic resonance imaging based measures of articular cartilage in osteoarthritis. Osteoarthritis Cartilage. 2006;14:974–983. doi: 10.1016/j.joca.2006.03.005. [DOI] [PubMed] [Google Scholar]
- 28.Hudelmaier M, Wirth W, Wehr B, Kraus V, Wyman BT, Hellio Le Graverand MP, et al. Femorotibial cartilage morphology: reproducibility of different metrics and femoral regions, and sensitivity to change in disease. Cells Tissues Organs. 2010;192(5):340–350. doi: 10.1159/000318178. [DOI] [PubMed] [Google Scholar]
- 29.Buckland-Wright C. Review of the anatomical and radiological differences between fluoroscopic and non-fluoroscopic positioning of osteoarthritic knees. Osteoarthritis Cartilage. 2006;14(Suppl A):A19–A31. doi: 10.1016/j.joca.2003.09.012. [DOI] [PubMed] [Google Scholar]
- 30.Raynauld JP, Martel-Pelletier J, Abram F, Dorais M, Haraoui B, Choquette D, et al. Analysis of the precision and sensitivity to change of different approaches to assess cartilage loss by quantitative MRI in a longitudinal multicentre clinical trial in patients with knee osteoarthritis. Arthritis Res Ther. 2008;10:R129. doi: 10.1186/ar2543. [DOI] [PMC free article] [PubMed] [Google Scholar]
- 31.Raynauld JP. Quantitative magnetic resonance imaging of articular cartilage in knee osteoarthritis. Curr Opin Rheumatol. 2003;15:647–650. doi: 10.1097/00002281-200309000-00021. [DOI] [PubMed] [Google Scholar]
- 32.Eckstein F, Heudorfer L, Faber SC, Burgkart R, Englmeier KH, Reiser M. Long-term and resegmentation precision of quantitative cartilage MR imaging (qMRI) Osteoarthritis Cartilage. 2002;10:922–928. doi: 10.1053/joca.2002.0844. [DOI] [PubMed] [Google Scholar]
- 33.Wirth W, Hellio Le Graverand MP, Wyman BT, Maschek S, Hudelmaier M, Hitzl W, et al. Regional analysis of femorotibial cartilage loss in a subsample from the Osteoarthritis Initiative progression subcohort. Osteoarthritis Cartilage. 2009;17:291–297. doi: 10.1016/j.joca.2008.07.008. [DOI] [PMC free article] [PubMed] [Google Scholar]
- 34.Wirth W, Eckstein F. A technique for regional analysis of femorotibial cartilage thickness based on quantitative magnetic resonance imaging. IEEE Trans Med Imaging. 2008;27:737–744. doi: 10.1109/TMI.2007.907323. [DOI] [PubMed] [Google Scholar]
- 35.Pelletier JP, Raynauld JP, Berthiaume MJ, Abram F, Choquette D, Haraoui B, et al. Risk factors associated with the loss of cartilage volume on weight-bearing areas in knee osteoarthritis patients assessed by quantitative magnetic resonance imaging: a longitudinal study. Arthritis Res Ther. 2007;9:R74. doi: 10.1186/ar2272. [DOI] [PMC free article] [PubMed] [Google Scholar]
- 36.Hunter DJ, Niu J, Zhang Y, Totterman S, Tamez J, Dabrowski C, et al. Change in cartilage morphometry: a sample of the progression cohort of the Osteoarthritis Initiative. Ann Rheum Dis. 2009;68:349–356. doi: 10.1136/ard.2007.082107. [DOI] [PMC free article] [PubMed] [Google Scholar]
- 37.Cicuttini FM, Baker J, Hart DJ, Spector TD. Association of pain with radiological changes in different compartments and views of the knee joint. Osteoarthritis Cartilage. 1996;4:143–147. doi: 10.1016/s1063-4584(05)80323-1. [DOI] [PubMed] [Google Scholar]
- 38.Cicuttini FM, Wluka AE, Wang Y, Davis SR, Hankin J, Ebeling P. Compartment differences in knee cartilage volume in healthy adults. J Rheumatol. 2002;29:554–556. [PubMed] [Google Scholar]
- 39.Cicuttini FM, Wluka AE, Wang Y, Stuckey SL. Longitudinal study of changes in tibial and femoral cartilage in knee osteoarthritis. Arthritis Rheum. 2004;50:94–97. doi: 10.1002/art.11483. [DOI] [PubMed] [Google Scholar]
- 40.Cicuttini F, Wluka A, Hankin J, Wang Y. Longitudinal study of the relationship between knee angle and tibiofemoral cartilage volume in subjects with knee osteoarthritis. Rheumatology (Oxford) 2004 doi: 10.1093/rheumatology/keh017. [DOI] [PubMed] [Google Scholar]
- 41.Eckstein F, Schnier M, Haubner M, Priebsch J, Glaser C, Englmeier KH, et al. Accuracy of cartilage volume and thickness measurements with magnetic resonance imaging. Clin Orthop. 1998:137–148. [PubMed] [Google Scholar]
- 42.Cicuttini FM, Wluka AE, Stuckey SL. Tibial and femoral cartilage changes in knee osteoarthritis. Ann Rheum Dis. 2001;60:977–980. doi: 10.1136/ard.60.10.977. [DOI] [PMC free article] [PubMed] [Google Scholar]
- 43.Cicuttini FM, Wluka AE, Wang Y, Stuckey SL. Longitudinal study of changes in tibial and femoral cartilage in knee osteoarthritis. Arthritis Rheum. 2004;50(1):94–97. doi: 10.1002/art.11483. [DOI] [PubMed] [Google Scholar]
- 44.Raynauld JP, Martel-Pelletier J, Berthiaume MJ, Labonté F, Beaudoin G, de Guise JA, et al. Quantitative magnetic resonance imaging evaluation of knee osteoarthritis progression over two years and correlation with clinical symptoms and radiologic changes. Arthritis Rheum. 2004;50(2):476–487. doi: 10.1002/art.20000. [DOI] [PubMed] [Google Scholar]
- 45.Wirth W, Larroque S, Davies RY, Nevitt M, Gimona A, Baribaud F, et al. Comparison of 1-year versus 2-year change in regional cartilage thickness in osteoarthritis results from 346 participants from the Osteoarthritis Initiative. Osteo Cart. 2011;19:74–83. doi: 10.1016/j.joca.2010.10.022. [DOI] [PMC free article] [PubMed] [Google Scholar]
- 46.Eckstein F, Maschek S, Wirth W, Hudelmaier M, Hitzl W, Wyman B, et al. One year change of knee cartilage morphology in the first release of participants from the Osteoarthritis Initiative progression subcohort: association with sex, body mass index, symptoms and radiographic osteoarthritis status. Ann Rheum Dis. 2009;68:674–679. doi: 10.1136/ard.2008.089904. [DOI] [PMC free article] [PubMed] [Google Scholar]
- 47.Wirth W, Nevitt M, Hellio Le Graverand MP, Benichou O, Dreher D, Davies RY, et al. Sensitivity to change of cartilage morphometry using coronal FLASH, sagittal DESS, and coronal MPR DESS protocols--comparative data from the Osteoarthritis Initiative (OAI) Osteoarthritis Cartilage. 2010;18:547–554. doi: 10.1016/j.joca.2009.12.003. [DOI] [PMC free article] [PubMed] [Google Scholar]
- 48.Eckstein F, Benichou O, Wirth W, Nelson DR, Maschek S, Hudelmaier M, et al. Magnetic resonance imaging-based cartilage loss in painful contralateral knees with and without radiographic joint space narrowing: Data from the Osteoarthritis Initiative. Arthritis Rheum. 2009;61:1218–1225. doi: 10.1002/art.24791. [DOI] [PMC free article] [PubMed] [Google Scholar]
- 49.Yoshioka H, Stevens K, Genovese M, Dillingham MF, Lang P. Articular cartilage of knee: normal patterns at MR imaging that mimic disease in healthy subjects and patients with osteoarthritis. Radiology. 2004;231:31–38. doi: 10.1148/radiol.2311020453. [DOI] [PubMed] [Google Scholar]
- 50.Waldschmidt JG, Rilling RJ, Kajdacsy-Balla AA, Boynton MD, Erickson SJ. In vitro and in vivo MR imaging of hyaline cartilage: zonal anatomy, imaging pitfalls, and pathologic conditions. Radiographics. 1997;17:1387–1402. doi: 10.1148/radiographics.17.6.9397453. [DOI] [PubMed] [Google Scholar]
- 51.Eckstein F, Lemberger B, Gratzke C, Hudelmaier M, Glaser C, Englmeier KH, et al. In vivo cartilage deformation after different types of activity and its dependence on physical training status. Ann Rheum Dis. 2005;64(2):291–295. doi: 10.1136/ard.2004.022400. [DOI] [PMC free article] [PubMed] [Google Scholar]
- 52.Kiel DP, Mercier CA, Dawson-Hughes B, Cali C, Hannan MT, Anderson JJ. The effects of analytic software and scan analysis technique on the comparison of dual X-ray absorptiometry with dual photon absorptiometry of the hip in the elderly. J Bone Miner Res. 1995;10(7):1130–1136. doi: 10.1002/jbmr.5650100719. [DOI] [PubMed] [Google Scholar]
- 53.Eckstein F, Wirth W. Quantitative cartilage imaging in knee osteoarthritis. Arthritis. 2011;1:1–19. doi: 10.1155/2011/475684. [DOI] [PMC free article] [PubMed] [Google Scholar]
- 54.Brem MH, Lang PK, Neumann G, Schlechtweg PM, Schneider E, Jackson R, et al. Magnetic resonance image segmentation using semi-automated software for quantification of knee articular cartilage - initial evaluation of a technique for paired scans. Skeletal Radiol. 2009;38(5):505–511. doi: 10.1007/s00256-009-0658-1. [DOI] [PMC free article] [PubMed] [Google Scholar]
- 55.Lassere MN. Longitudinal and observational studies module. J Rheumatol. 1999;26(2):459–468. [PubMed] [Google Scholar]
- 56.Bruynesteyn K, Boers M, Kostense P, van der Linden S, van der Heijde Deciding on progression of joint damage in paired films of individual patients: smallest detectable difference or change. Ann Rheum Dis. 2005;64:179–182. doi: 10.1136/ard.2003.018457. [DOI] [PMC free article] [PubMed] [Google Scholar]


