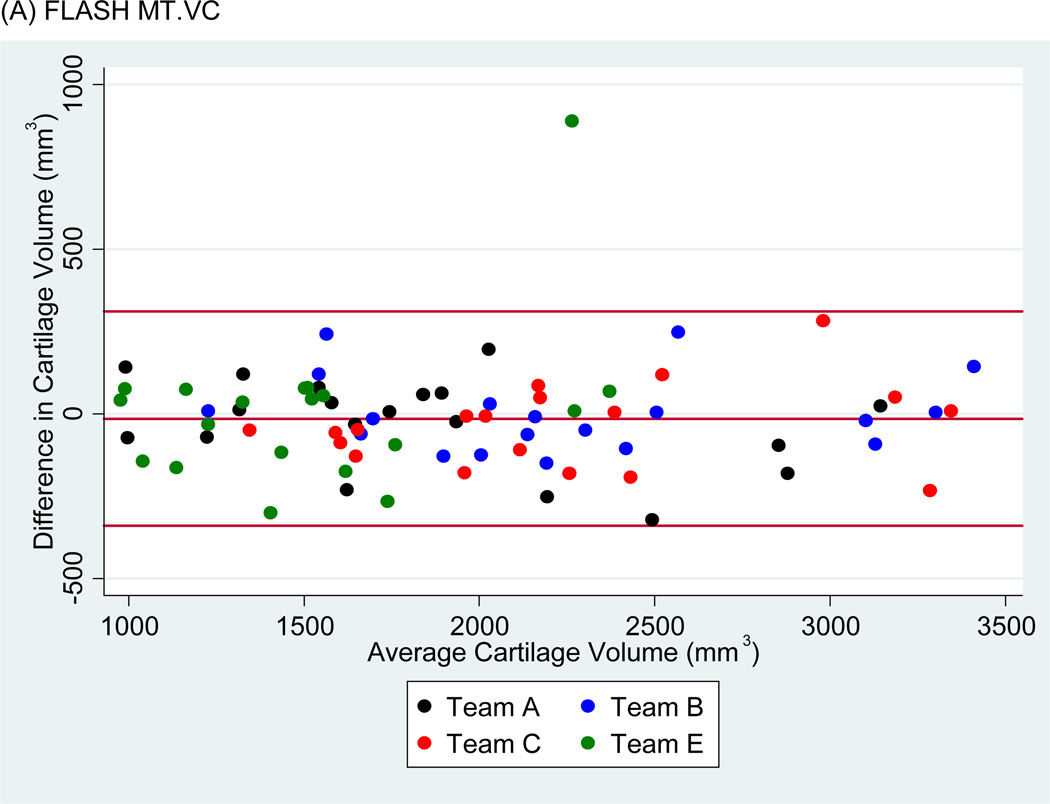
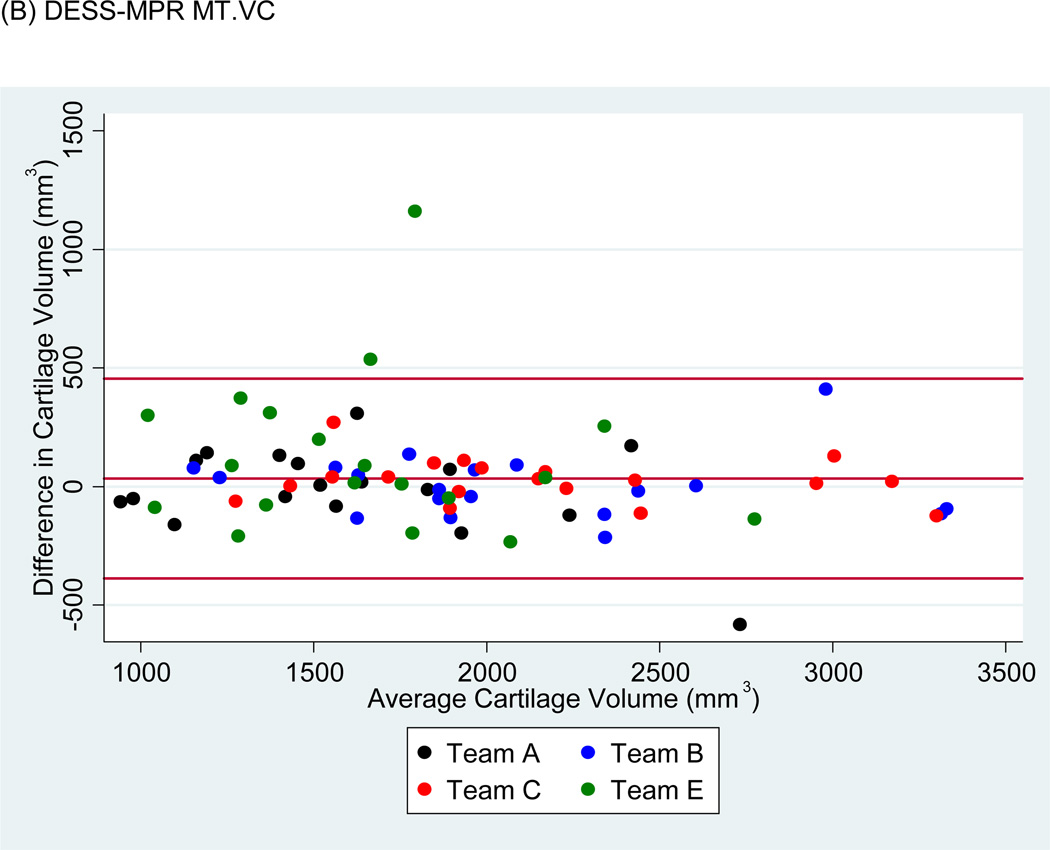
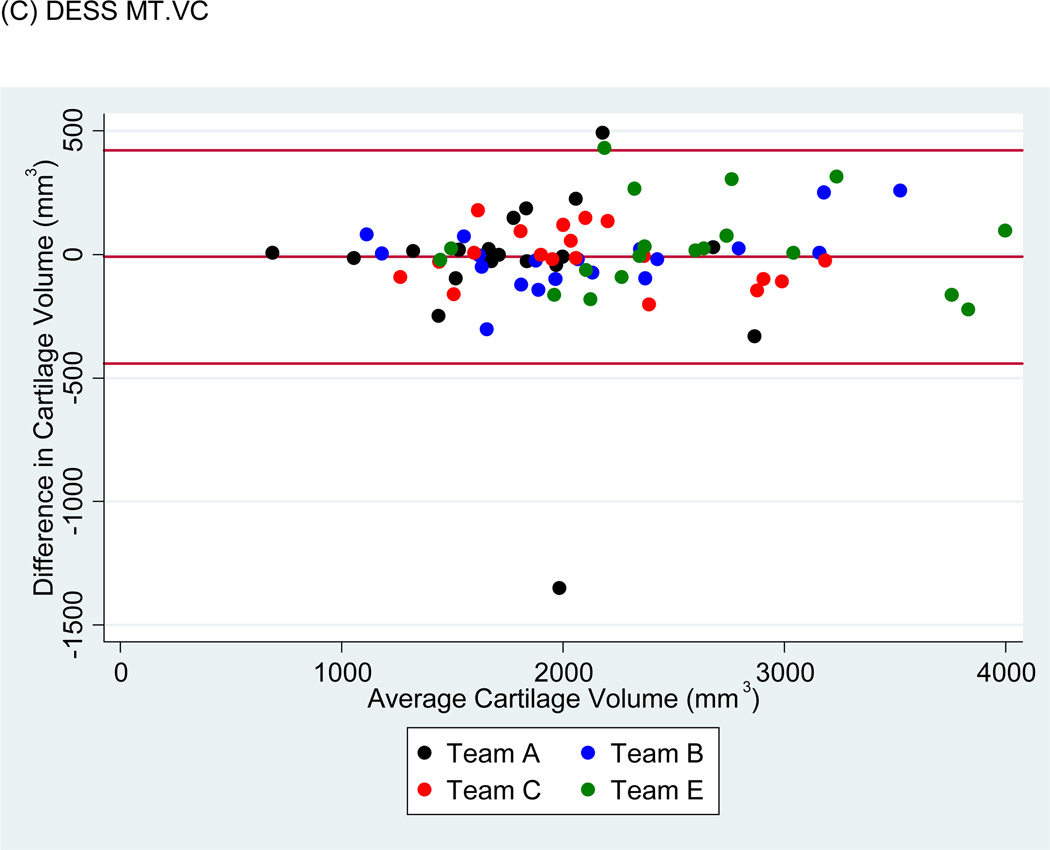
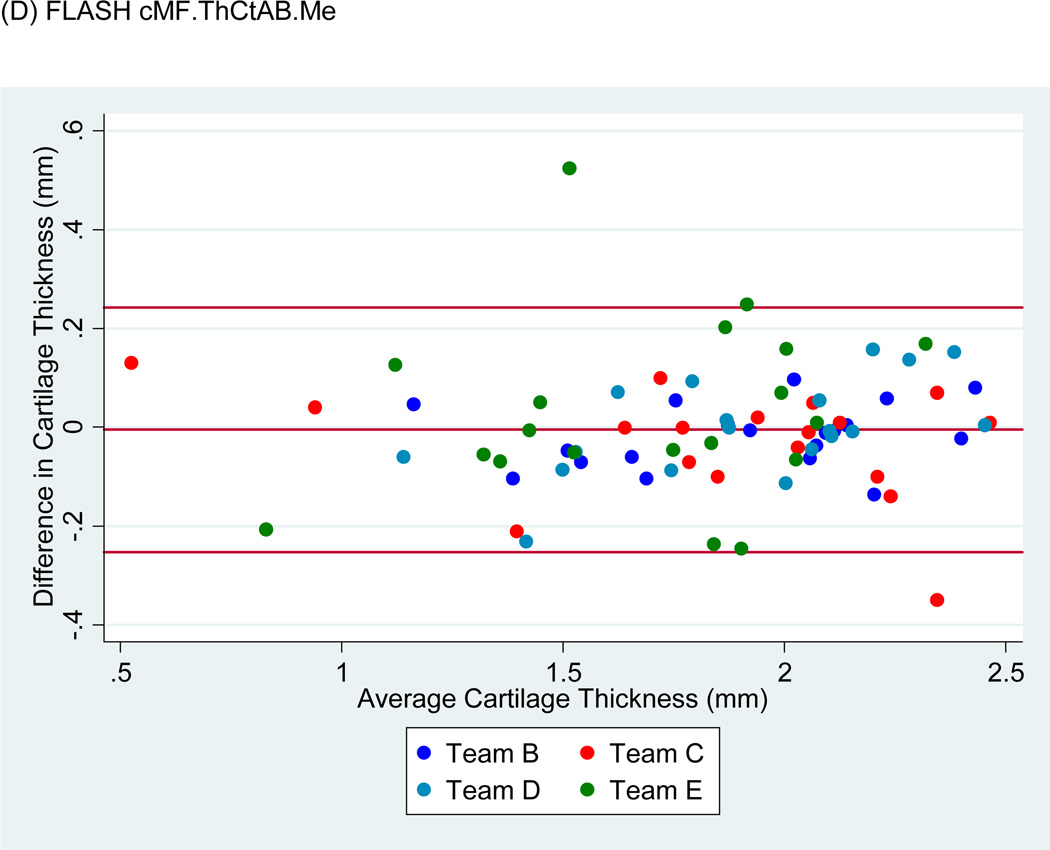
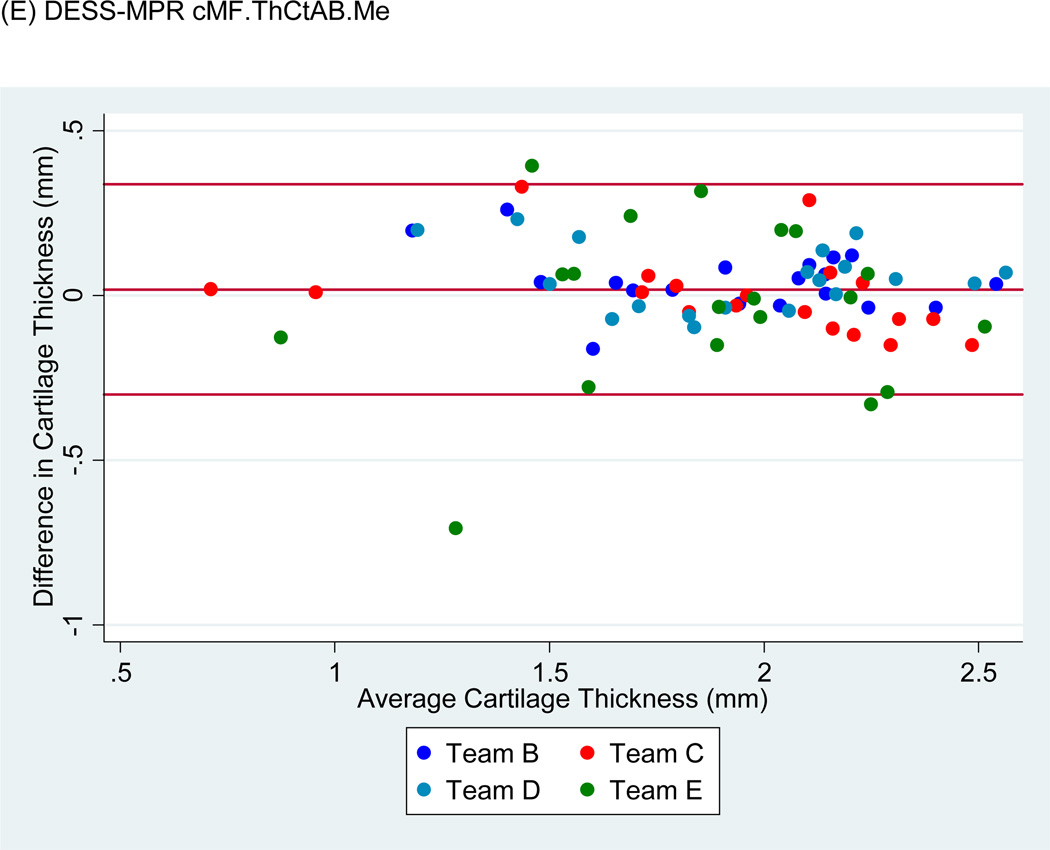
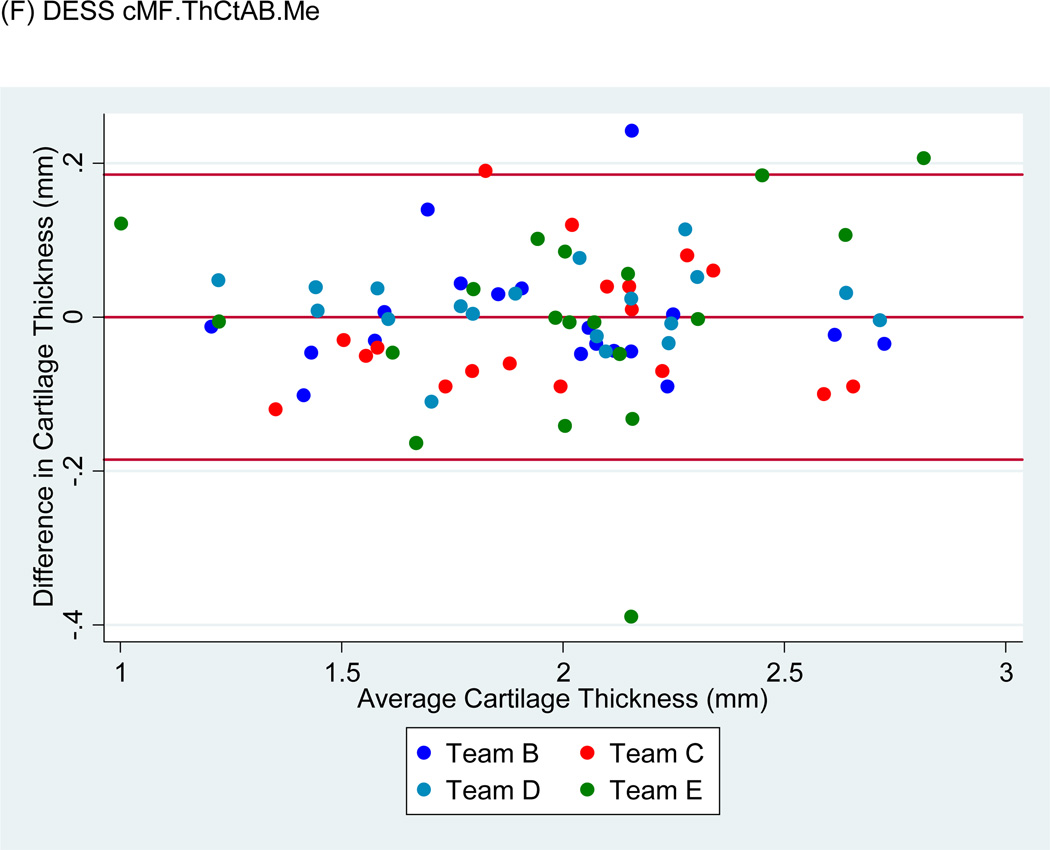
Figure 4.
Sample Bland-Altman plots for (A) FLASH medial tibial cartilage volume (MT.VC), (B) DESS-MPR MT.VC, (C) DESS MT.VC, (D) FLASH central medial femoral mean cartilage thickness over the total area of bone (cMF.ThCtAB.Me), (E) DESS-MPR cMF.ThCtAB.Me, and (F) DESS cMF.ThCtAB.Me for all segmentation teams. These plots show the difference in mm3 for VC and mm for ThCtAB.Me between the different test-rest acquisitions. The x-axis corresponds to the mean value and the y-axis to the difference between test-retest values. The mean difference is the central solid line. Outliers are identified by points above and below two standard deviations (upper and lower solid lines). Each plot contains one outlier that was removed in sensitivity analyses.

