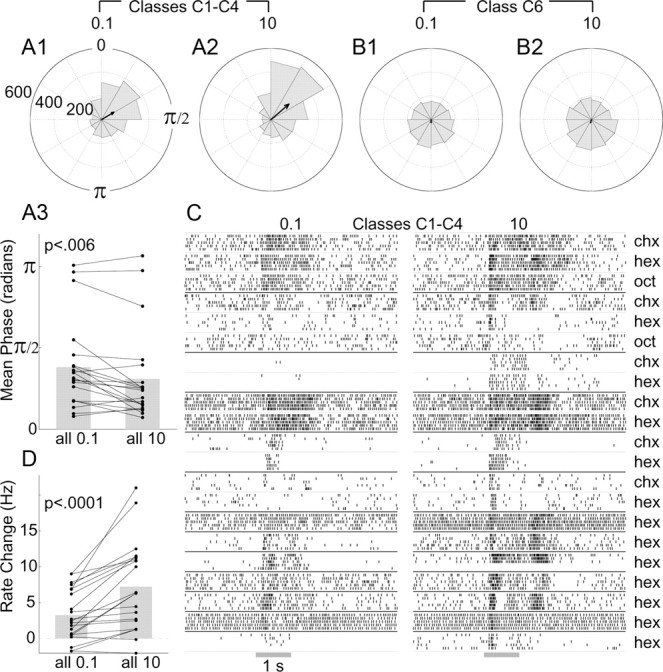
Figure 5.

Coding odor concentration in C1–C4 LHNs. A, Spike phase positions in C1–C4 LHNs advance with odor concentration, shown by polar histograms of responses to 0.1% (A1) and 10% (A2) odor concentrations (>2200 spikes for each concentration). Arrows show vector average. Note the decrease in phase evoked by the higher concentration. A3, Pairwise comparison of the mean phase for C1–C4 recordings evoked by low and high concentrations (two-tailed paired t test; n = 21 cell–odor combinations, 13 cells; see C) shows significant differences. B, Phase positions of spikes in β-LNs (class C6, >2200 spikes) (B1, B2) show little phase preference; vector average is close to zero. C, Raster plots show responses of the 13 C1–C4 LHNs to both 0.1% and 10% concentrations of various odors. D, Pairwise comparison of the net change in firing rate evoked by high and low concentrations (average firing rate in a 2 s period from odor onset minus the average background firing rate); two-tailed paired t test for the same (n = 21) cell–odor combinations.
