Figure 1.

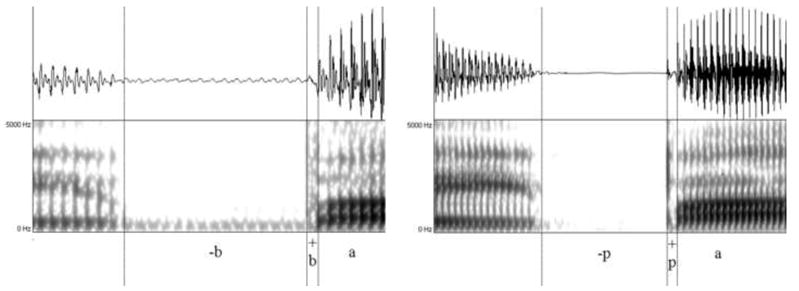
Oscillograms and spectrograms illustrating VOT measurement protocol. On left, negative VOT is reported, denoted by -b. On right, positive VOT reported, denoted by +p.

Oscillograms and spectrograms illustrating VOT measurement protocol. On left, negative VOT is reported, denoted by -b. On right, positive VOT reported, denoted by +p.