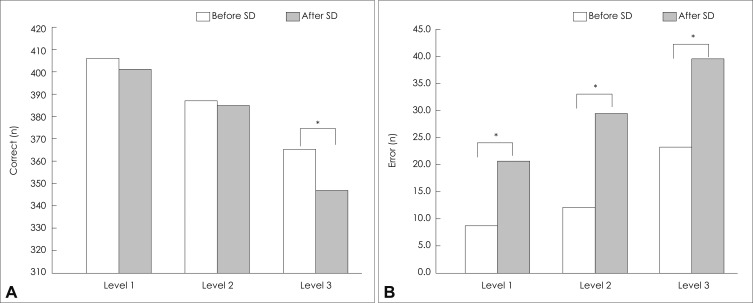
Fig. 2.
Comparison of the Continuous Performance Test results before and after 24 h of sleep deprivation (SD). The mean scores of correct (A) and error (B) responses are shown before and after SD according to the test level (i.e., 1-3). The mean score of correct responses was significantly reduced after SD only at the most difficult test level. However, the mean scores of error responses were significantly increased at all test levels. *p<0.05 (Wilcoxon signed-rank test with multiple comparisons).

