
Figure 4.
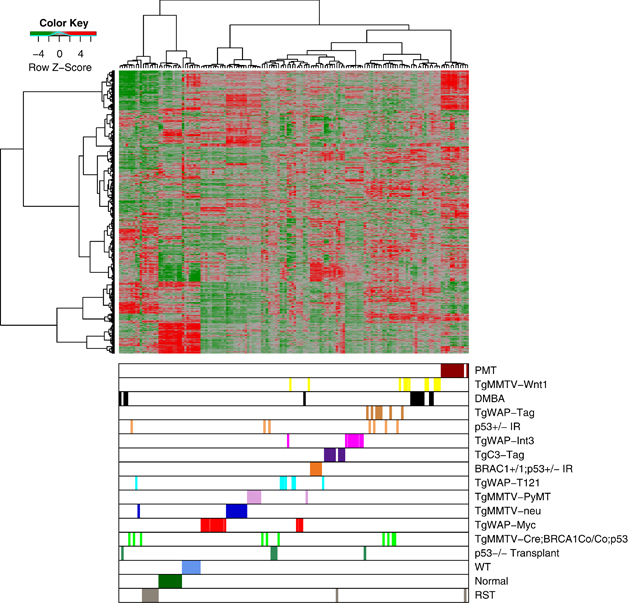
Unsupervised cluster analysis of murine mammary tumors samples from Herschkowitz et al. (2007) with our WT (blue), PMT (red) and RST (gray) samples. Each sample is identified by a color-coded matrix below the dendrogram. The legend shows the z-scores. The values were mean centered, and the colors scaled from −4 to 4 standard deviations.