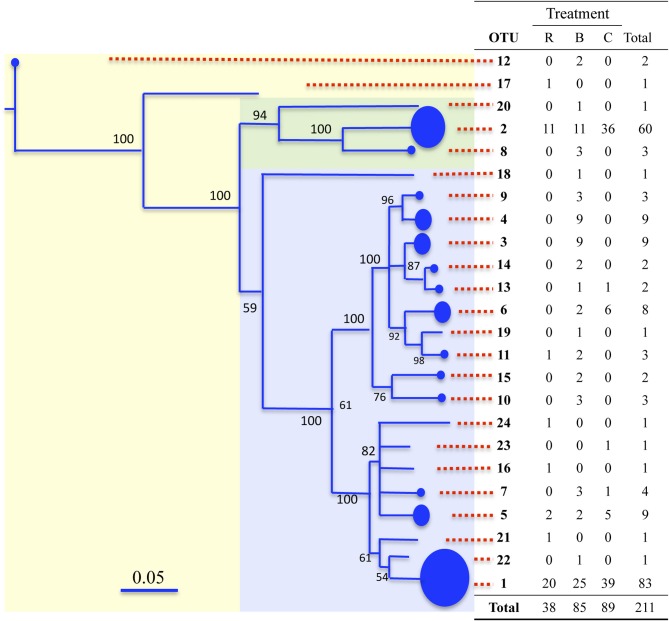
Figure 5.
Phylogram of archaeal amoA sequences from the composts. The two main branches are indicated by the light green and blue areas. Each tip is an OTU, and the OTU number is given in the table. The size of circles at the tips is proportional to the number of sequences comprising that OTU, which are given in the table. Bare tips indicate single sequences. Abbreviations in the table are: R, rice; B, bagasse and C, coffee. In the latter two, the sheep and cow manure treatments are pooled. Bootstrap values (1000 replicates) are given at nodes.

