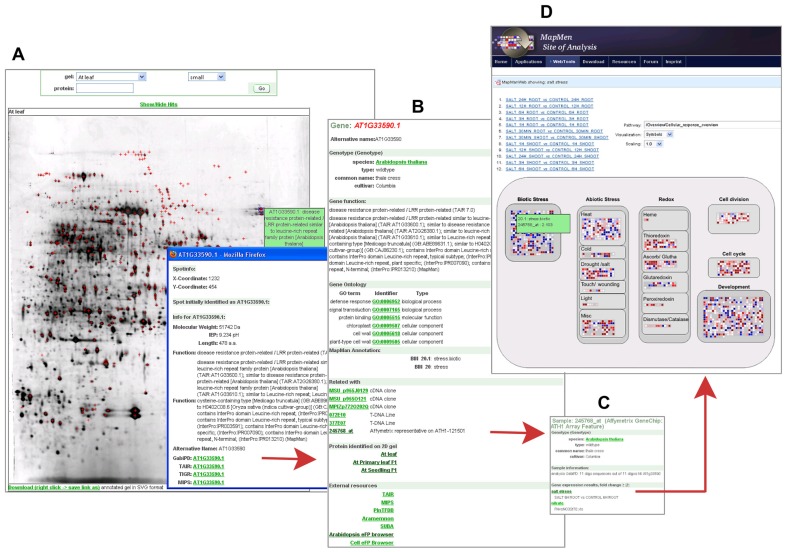
FIGURE 1.
Proteomic data in GabiPD. (A) 2D-PAGE gel image from A.thaliana primary leaf at GabiPDs Proteomics pages. All protein spots identified by MS are highlighted with red crosses. Clicking on one distinct spot (blue cross-hair) directs the user to a more detailed description of the related protein, i.e., a disease resistance protein-related (AT1G33590.1). The related Gene GreenCard is accessible via the integrated GabiPD link. (B)Gene GreenCard of AT1G33590.1 with detailed annotation information (GO, MapMan, etc.) and information on all GabiPD data related to this gene, such as links to 2D PAGE-images of other A. thaliana tissues. The integrated link to a related Affymetrix probe-set (245768_at) directs the user to the GreenCard of this probe. (C) The GreenCard of the Affymetrix probe-set 245768_at includes, beside the probe description, a list of related transcriptomic experiments where the transcript is significantly up- or down-regulated, e.g., a salt stress experiment. The related experimental data are linked. (D) MapManWeb user interface at the MapMan Site of Analysis displaying the results of the salt stress transcriptomic experiment in A. thaliana. AT1G33590.1 is up-regulated as indicated by a blue filled rectangle representing 245768_at in the “Biotic Stress” field of the presented “Cellular_Response_overview.”

