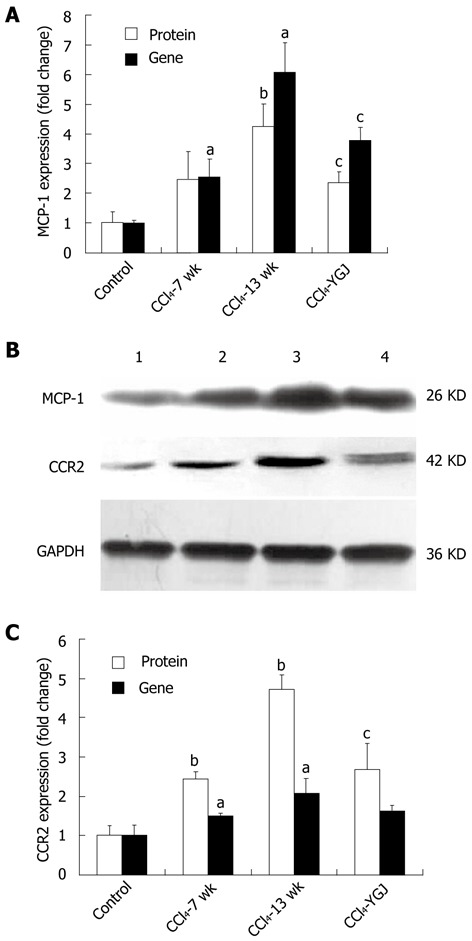
Figure 7.

Gene expression analyzed by real-time polymerase chain reaction and protein expression analyzed by Western blotting of monocyte chemotaxis protein-1 and CC chemokine receptor 2 in CCl4-induced chronic liver injured bone marrow chimera mice. A: MCP-1 gene and protein expression. For both genes the relative expression is quantified using the control group as the basal level; B: MCP-1 and CCR2 bands by Western blotting. Band 1, control group; band 2, CCl4 7 wk group; band 3, CCl4 13 wk group; and band 4, CCl4 + Yiguanjian (YGJ) group; C: CCR2 gene and protein expression. For both genes the relative expression is quantified using the control group as the basal level. MCP-1: Monocyte chemotaxis protein-1; CCR2: CC chemokine receptor 2; GAPDH: Glyceraldehydes-3- phosphate dehydrogenase. aP < 0.05, bP < 0.01 vs week 0 control group; cP < 0.05 vs the same time-point CCl4 group.
